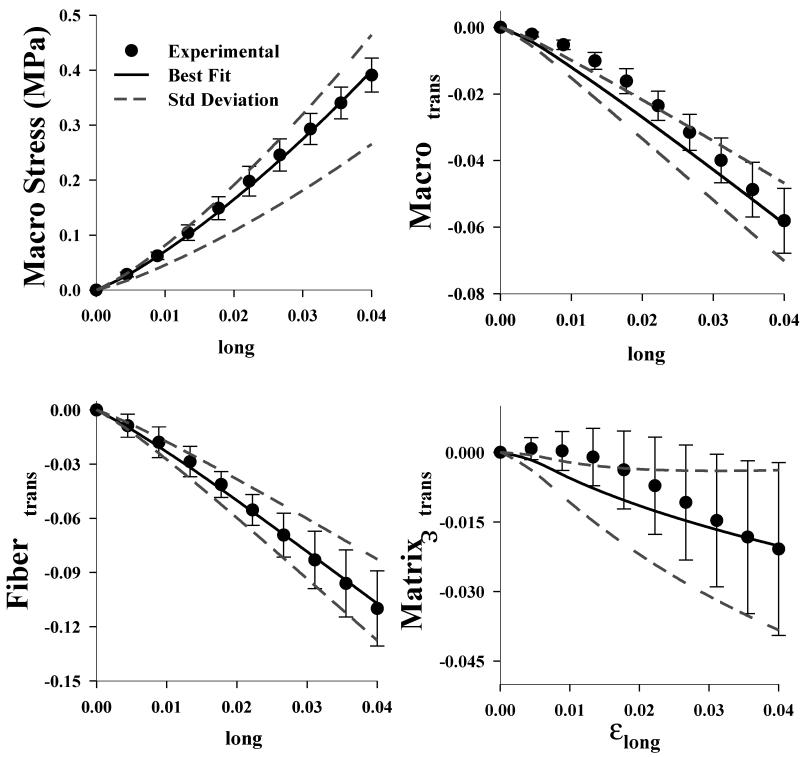
Figure 3.
Micromechanical FE model validation. The FE model predictions were in excellent agreement with the experimental data. Results are shown for the stress-strain (upper left), the macroscopic strain (upper right), the fiber strain (lower left) and the matrix strain (lower right). In all plots the points represent the experimental data, the solid line is the FE prediction obtained using the best fit coefficients and the dashed lines are the FE predictions obtained using coefficients plus or minus one standard deviation. The normalized root mean square error (NRMSE) is shown at the bottom of each plot.

