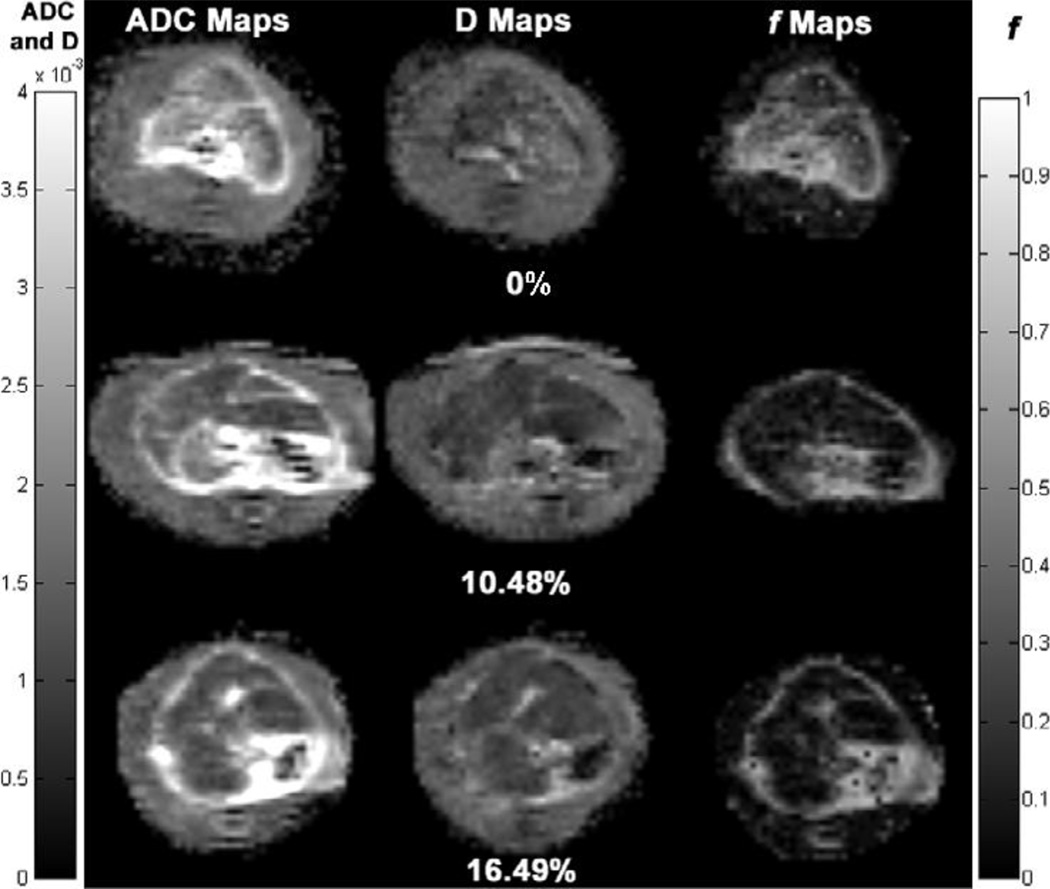
Figure 3.
Representative axial ADC, D (true diffusion coefficient) and f (perfusion fraction) maps of Wistar rat livers at different fibrosis degrees (0%, 10.48% and 16.49%). The hepatic ADC and f values of 0% fibrosis (brighter on ADC and f maps) were higher than that of 10.48% and 16.49% fibrosis (darker on ADC and f maps), while hepatic D values were similar in the three levels of fibrosis. Left grey scale indicated values for ADC and D maps. Right grey scale indicated values for f maps.

