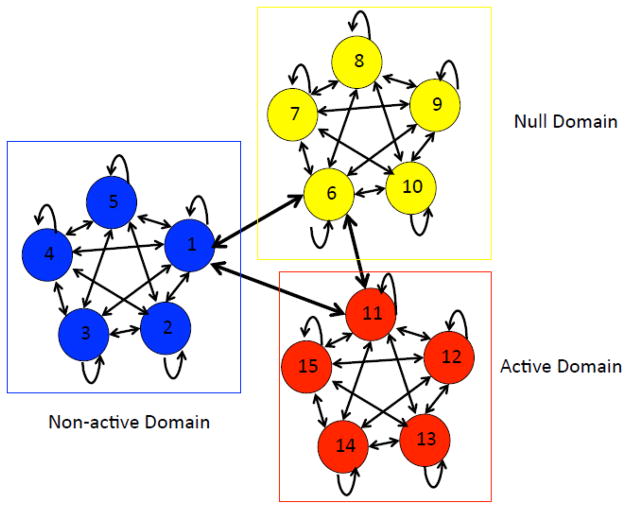
Figure 1.
The topology of our THMM. Each bin-level state is represented by a circled color-coded according to its corresponding domain-level state (represented by a box). Note that transitions between different domain-level states can only occur via a special bin-level state from each domain. States within the null domain are represented by the color yellow; states within the active domain are shown in red; states within the non-active domain are in blue.

