
Figure 5.
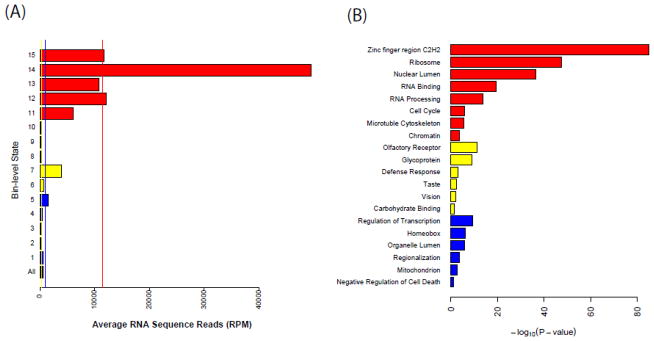
Functional characterization of the chromatin states. (A) The average RNA-seq values for each bin-level state. Vertical lines represent the mean value for each domain. The bottom track is the truncated genome-wide average. (B) Representative enriched functions and pathways identified using DAVID. P-values for enrichment in the corresponding DAVID category are determined by the Fisher exact test and adjusted for multiple testing by Benjamini-Hochberg procedure. Small p-values indicate evidence of an association with the corresponding DAVID category. Colors of each state correspond to domain membership as in Figure 1.