
Figure 5.
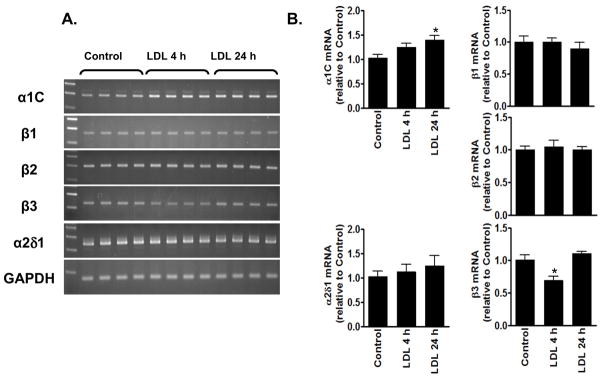
The effects of LDL on the expression of Ca2+ channel subunit mRNAs. (A) PCR results obtained from sham+LDL are shown with the left lanes representing DNA size markers. (B) Real-time PCR data are shown with columns and error bars indicating the mean and SEM. *p<0.05 compared to Control.