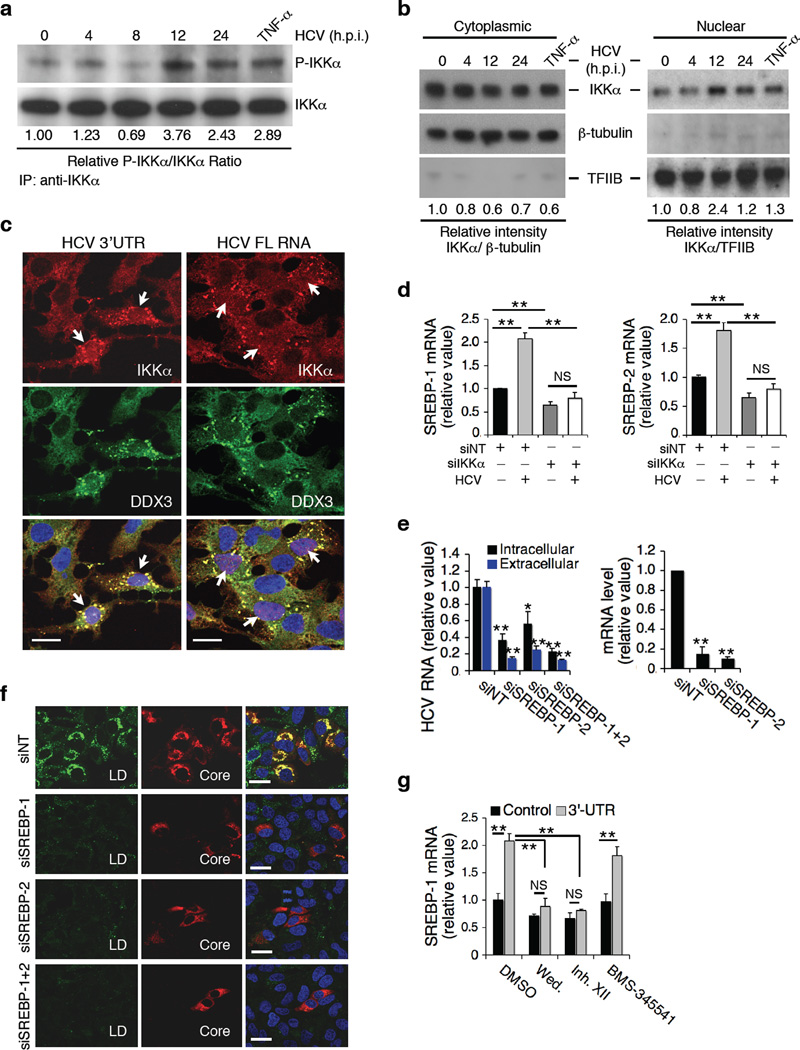
Figure 5.
HCV infection, IKKα activation, SREBP induction and LD formation. (a) Effect of HCV infection or TNF-α treatment on phosphorylation of IKKα, as shown by immunoprecipitation followed by Western blot. Phospho-IKKα and IKKα bands were quantified using ImageJ software and the ratios of P-IKKα over IKKα are provided beneath the blots. (b) Nucleus/cytoplasm (N/C) ratio of IKKα determined by dividing the relative intensity of nuclear IKKα normalized to TFIIB over that of cytoplasmic IKKα normalized to β-tubulin. The highest N/C ratio was achieved at 12 h post-infection (3.98). Control TNF-α treatment led to an increased N/C ratio of 2.15. (c) Huh7.5.1 cells were treated with HCV 3’UTR or full-length (FL) HCV RNA for 4 h, immunostaining for DDX3X and IKKα was performed. White arrows indicate nuclear translocation of IKKα in viral RNA-treated cells showing co-localization of IKKα and DDX3X. (d) SREBP expression in IKKα-deficient cells. SREBP mRNA levels were measured at 72 h after siRNA treatment, 24 h after HCV infection or after both treatments, and were normalized as relative values to siNT-treated samples in the absence of HCV infection. (e,f) Effects of SREBP silencing in Huh7.5.1 cells on HCV infection (e) and LD formation (f). (g) Effects of various IKK inhibitors (wedelolactone, 30 µM; IKK Inhibitor XII, 10 µM; BMS-345541, 1µM) on HCV 3’UTR-mediated induction of SREBP-1. (d,e,g) Error bars represent ± s.d. of triplicate experiments. **, P < 0.01. *, P < 0.05. NS, not significant. (c,f) Scale bars represent 20 µm.

