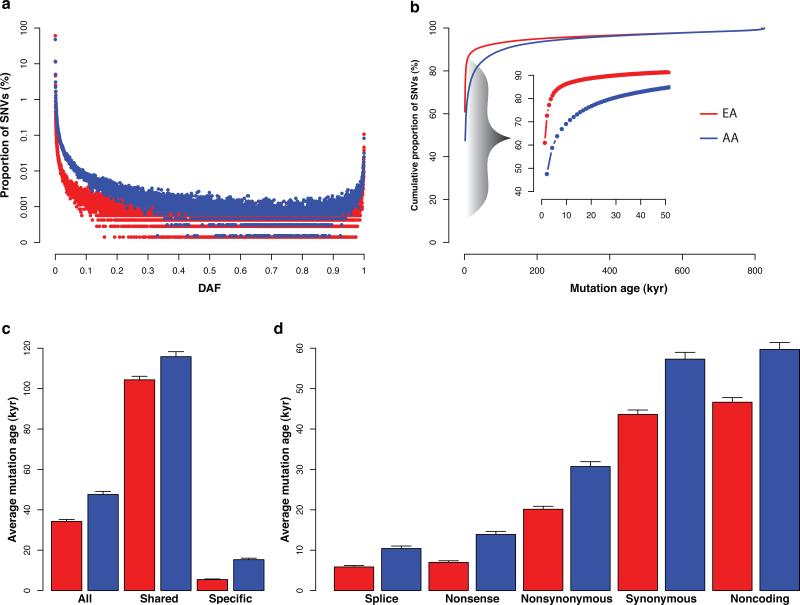
Figure 1. The vast majority of protein-coding SNVs arose recently.
a, The site frequency spectrum for EAs (red) and AAs (blue). b, Cumulative proportion of SNVs for a given allele age. The inset highlights the cumulative proportion of SNVs that are estimated to have arisen in the last 50 kyr. c, Average age for all SNVs, SNVs found in both the EAs and AAs (shared), and SNVs found in only one population (specific). d, Average age for different types of variants. Error bars denote standard deviations.

