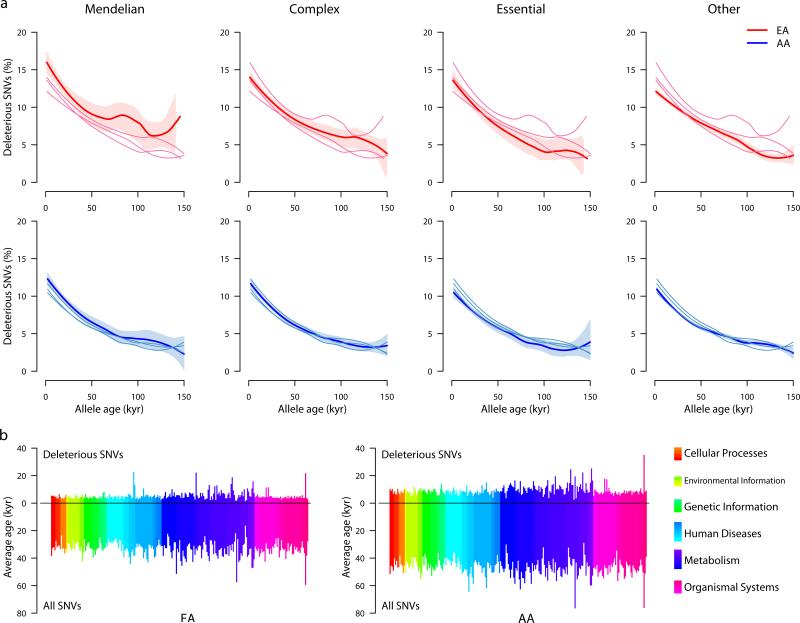
Figure 4. Heterogeneity of allele age across genes and pathways.
a, Distribution of the proportion of deleterious SNVs for Mendelian, complex, essential, and other genes in EAs (top) and AAs (bottom) versus age in kyr. Data for each of the four categories of genes is shown in each plot, with darker lines representing the specific gene class indicated by the column label. Shaded regions define 95% confidence intervals obtained by bootstrapping. b, Average ages for deleterious (projecting up) and all (projecting down) SNVs across 235 KEGG pathways that can be organized into six broad classes (see legend on the right). Each of the six classes is comprised of multiple sub-classes, indicated by the different color shadings.

