Figure 2.

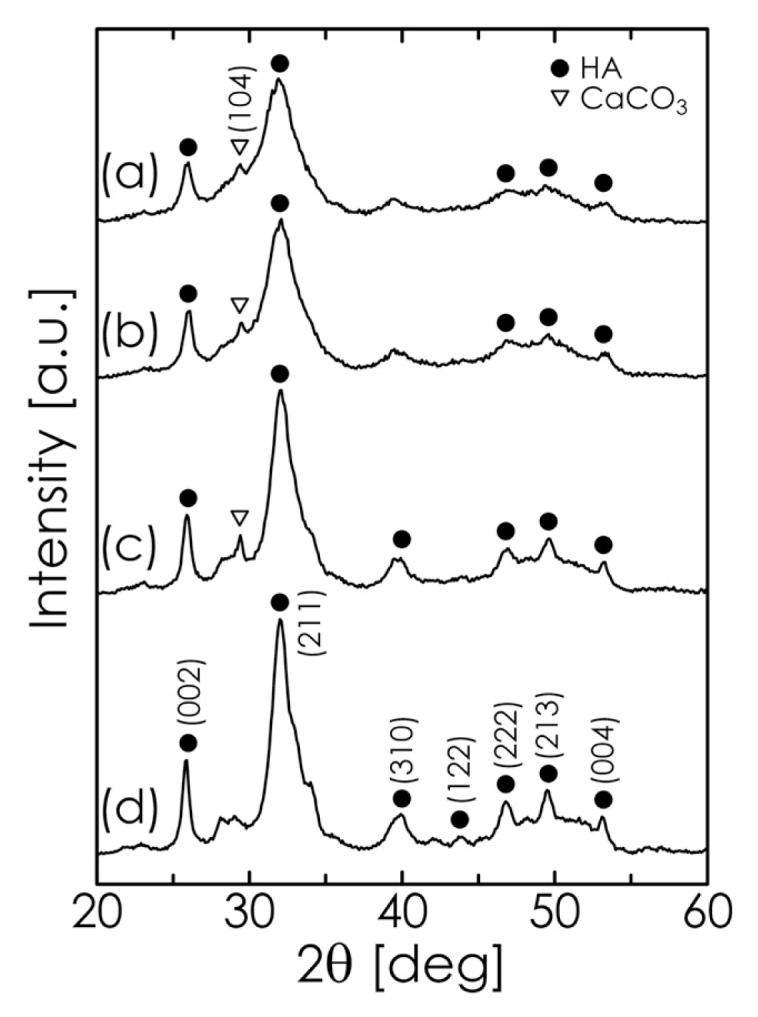
XRD pattern of samples obtained after milling for 6 h at different pH values: (a) 12.0; (b) 12.5; (c) 13.0; and (d) 13.5.

XRD pattern of samples obtained after milling for 6 h at different pH values: (a) 12.0; (b) 12.5; (c) 13.0; and (d) 13.5.