
Figure 2.
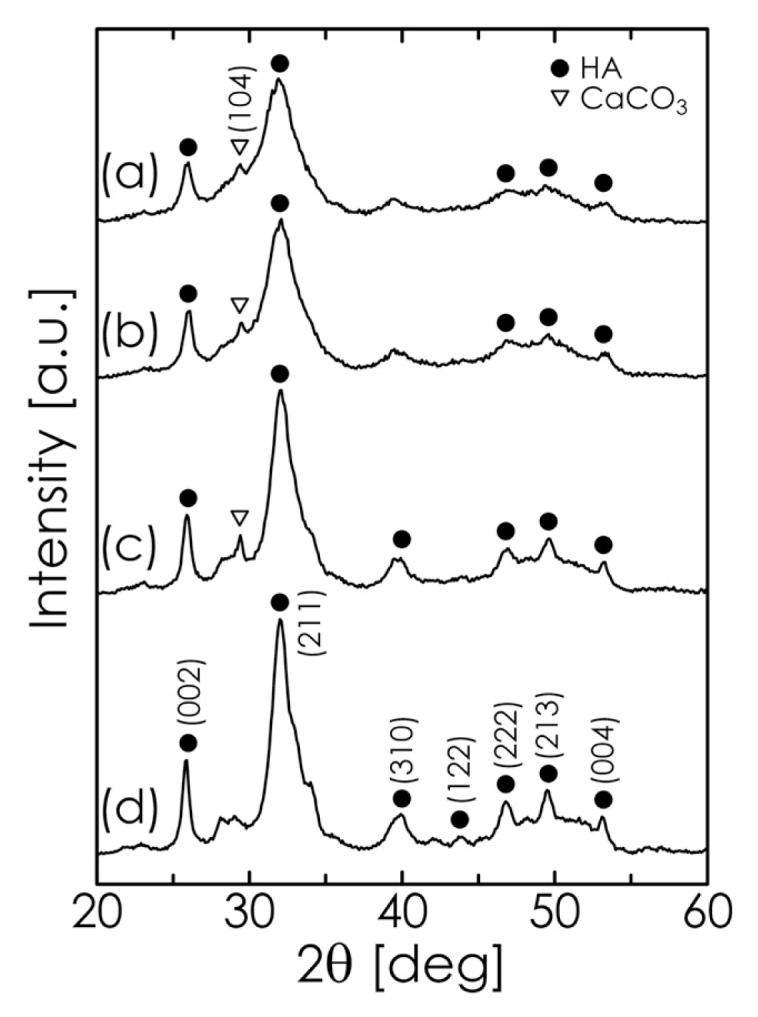
XRD pattern of samples obtained after milling for 6 h at different pH values: (a) 12.0; (b) 12.5; (c) 13.0; and (d) 13.5.
Official websites use .gov
A
.gov website belongs to an official
government organization in the United States.
Secure .gov websites use HTTPS
A lock (
) or https:// means you've safely
connected to the .gov website. Share sensitive
information only on official, secure websites.
XRD pattern of samples obtained after milling for 6 h at different pH values: (a) 12.0; (b) 12.5; (c) 13.0; and (d) 13.5.