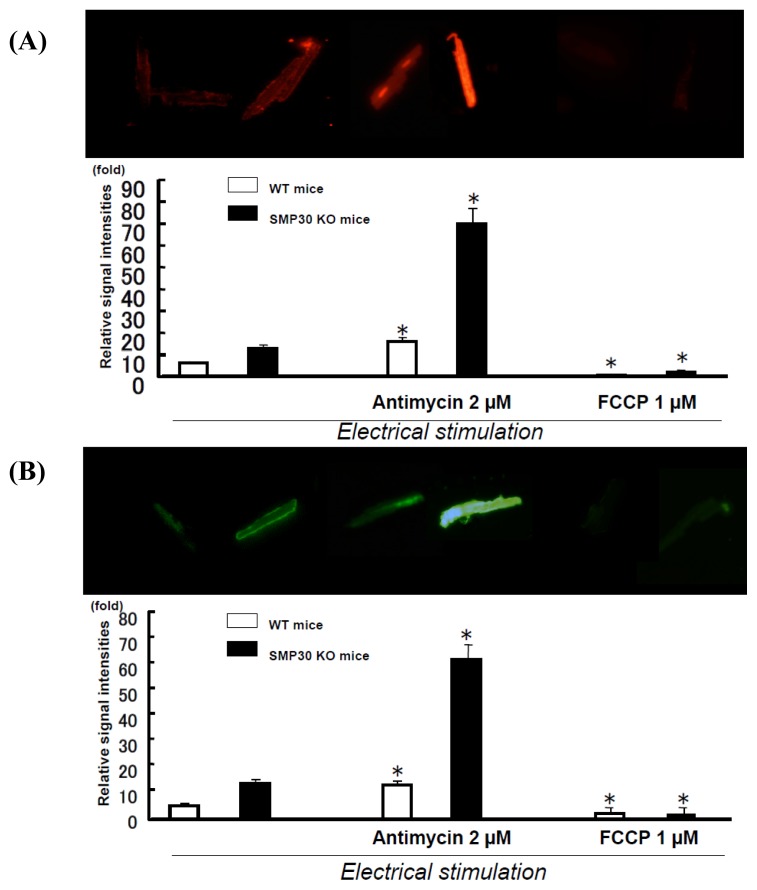
Figure 3.
DHE and DCF staining in paced cardiac myocytes with antimycin or FCCP. Representative DHE (A) and DCF staining (B) in cardiac myocytes (Upper panel). Summary data of DHE and DCF staining in cardiac myocytes (Lower panel). The signals of DHE and DCF were enhanced by antimycin (2 μM) and attenuated by FCCP (1 μM). Values are expressed as the mean ± S.E.M. * p < 0.01 vs. without agents (n = 12 each).

