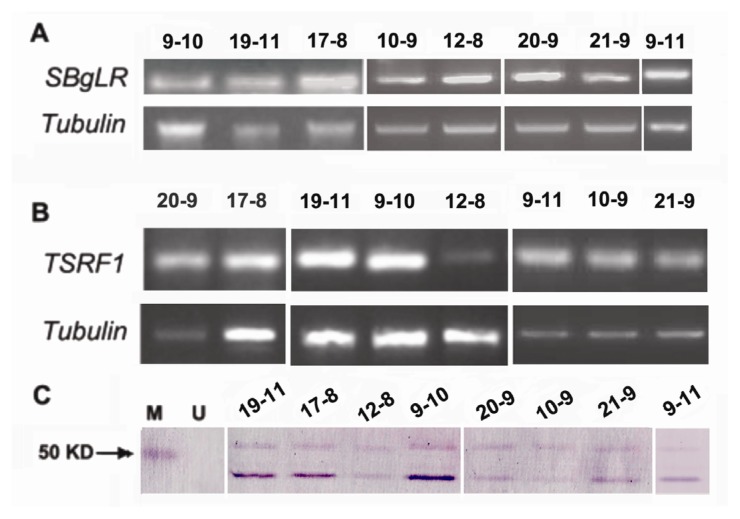
Figure 2.
Expression of transgenes in T1 maize (partial results are shown). (A) Semi-quantification RT-PCR analysis of SBgLR in transgenic maize immature seeds (22 DAP); (B) semi-quantification RT-PCR analysis of TSRF1 in transgenic maize leaves; (C) Western blot analysis of SBgLR in transgenic maize immature seeds (20 DAP). M, protein marker; U, non-transformed maize plants. Numbers on the top of each figure represent the transgenic line number.

