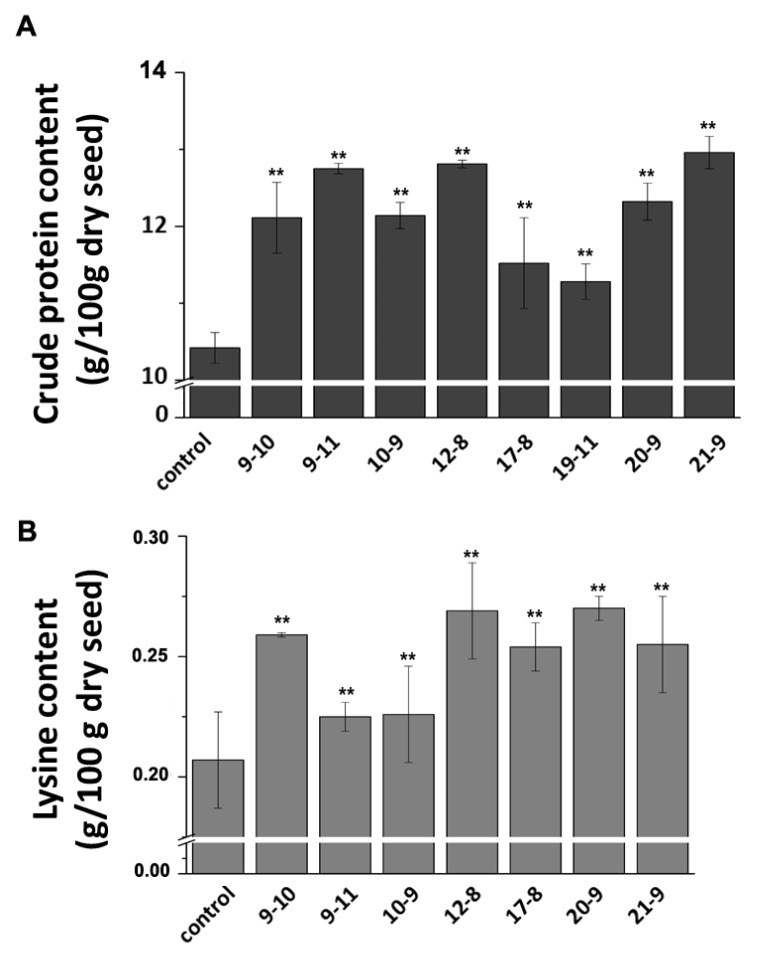
Figure 4.
Protein and lysine levels were simultaneously increased in T1 transgenic seeds. (A) Protein content; (B) lysine content. The crude protein and lysine contents are expressed as g/100 g dry seed. Data are averages of triplicates ± standard deviations. Asterisks, **, denote transgenic lines statistically different from Control by Student t-test at p < 0.01. The lysine content of line 19–11 was not measured due to limited amount of seeds.

