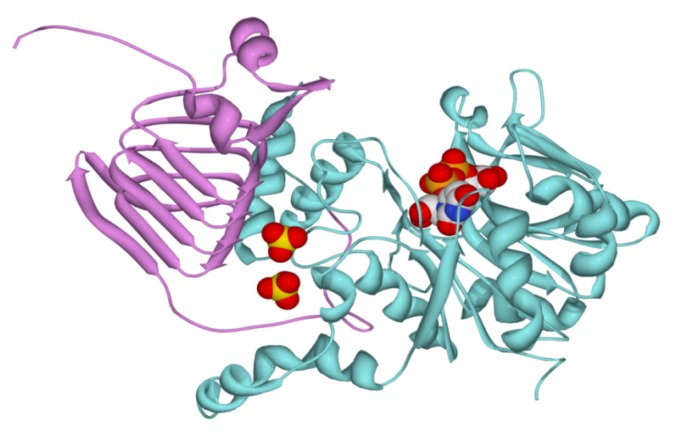
Figure 7.
Modeling of the chimeric enzyme. The model was obtained as indicated in the Experimental Section. The UDP-Glc PPase domain from S. mutans is depicted in cyan, whereas the C-domain from E. coli ADP-Glc PPase is depicted in pink. Two sulfates modeled from the structure of the potato tuber ADP-Glc PPase are shown, together with the product UDP-Glc.

