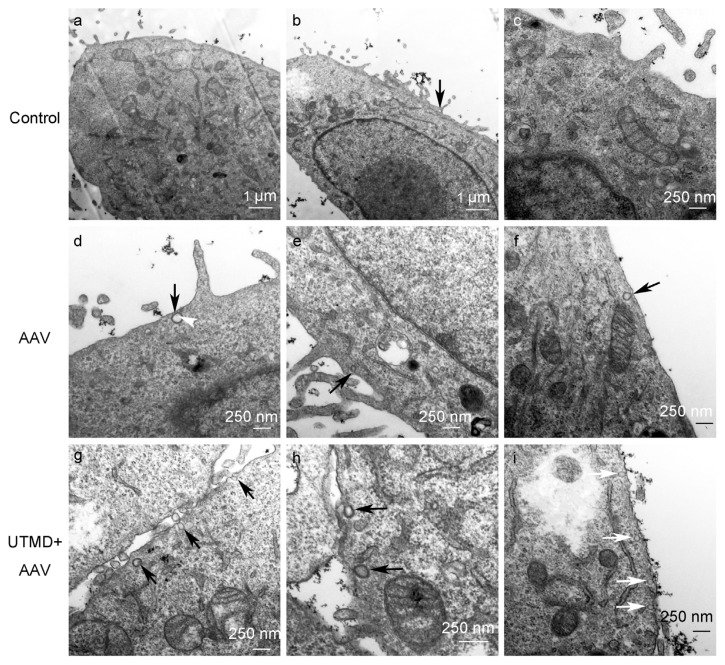
Figure 4.
TEM of HeLa cells not treated, treated with AAV or UTMD+AAV at 45 min post-treatment. CPs (coated with thick, coarse cyst walls) are indicated by black arrows and nCPs (with cyst walls that are thin and smooth) are indicated by white arrows. AAV particles are indicated by white arrowheads. Untreated cells served as the control group.

