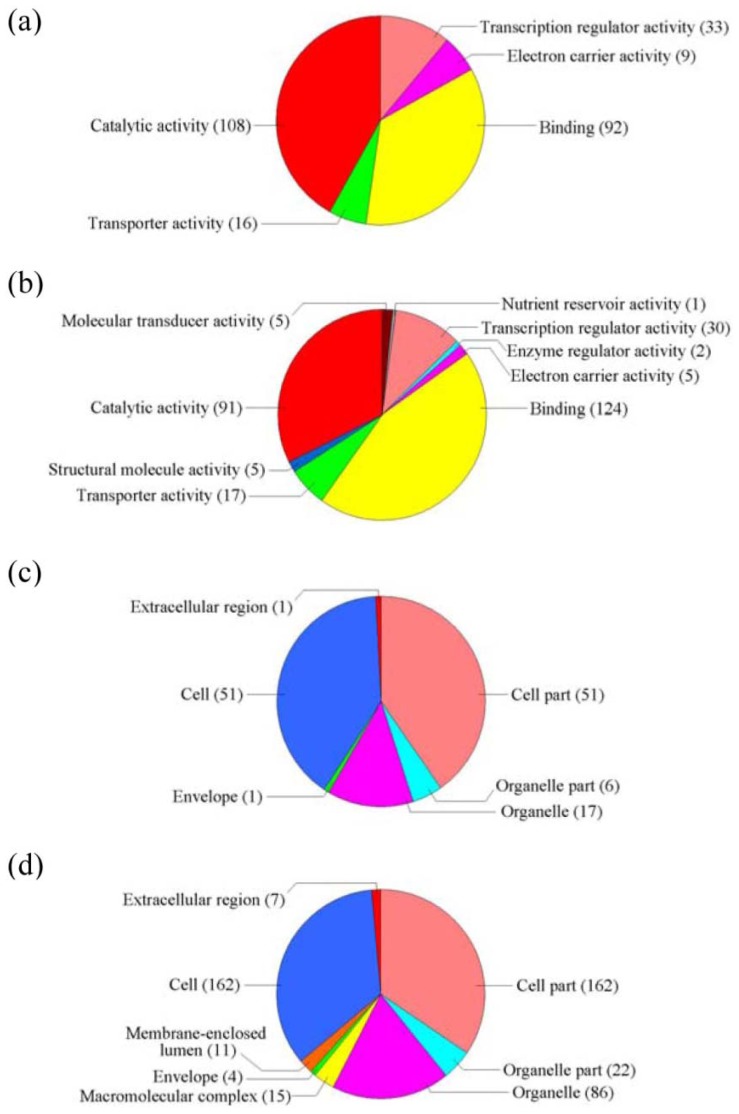
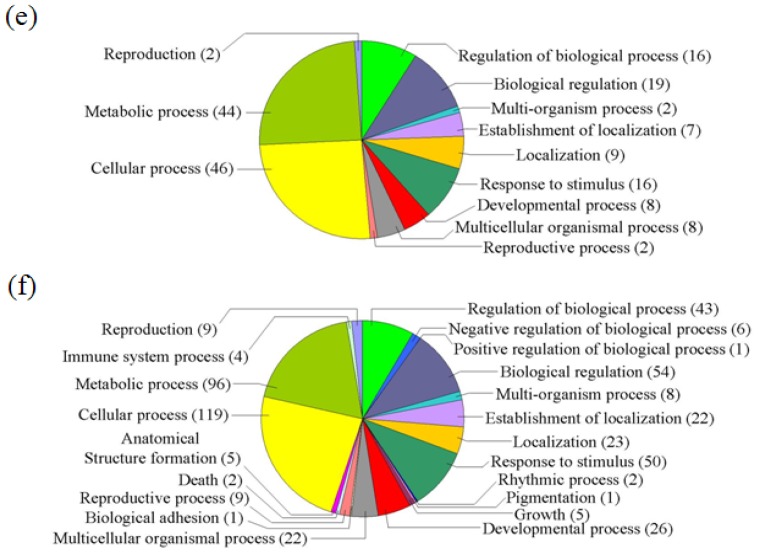
Figure 8.
GO term pie chart of the only differently downregulated genes under NaCl and ABA stresses. (a) and (b) indicates GO term pie picture of “Molecular function” for the only downregulated genes in the NaCl- and ABA-stressed samples, respectively; (c) and (d) indicates GO term pie picture of “Cellular component” for the only downregulated genes from NaCl and ABA stresses, respectively; (e) and (f) indicates GO term pie picture of “Biological process” for the only downregulated genes under NaCl and ABA stresses, respectively.


