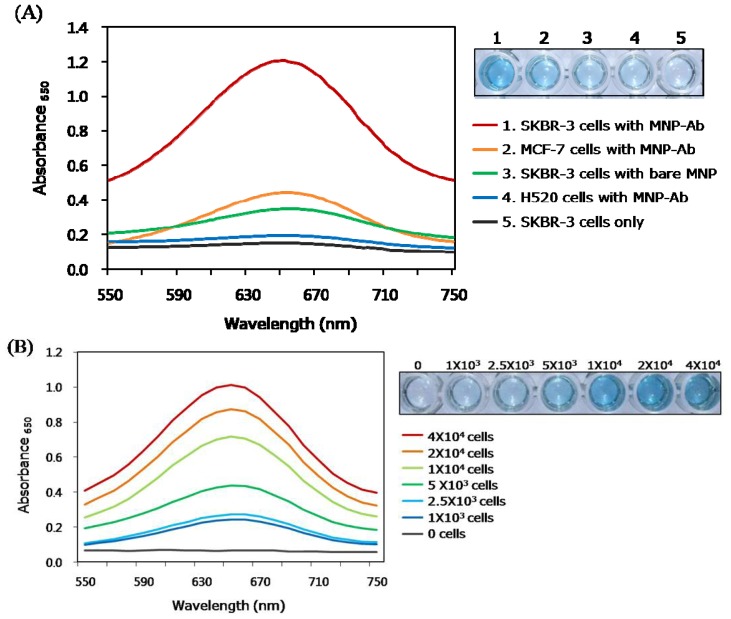
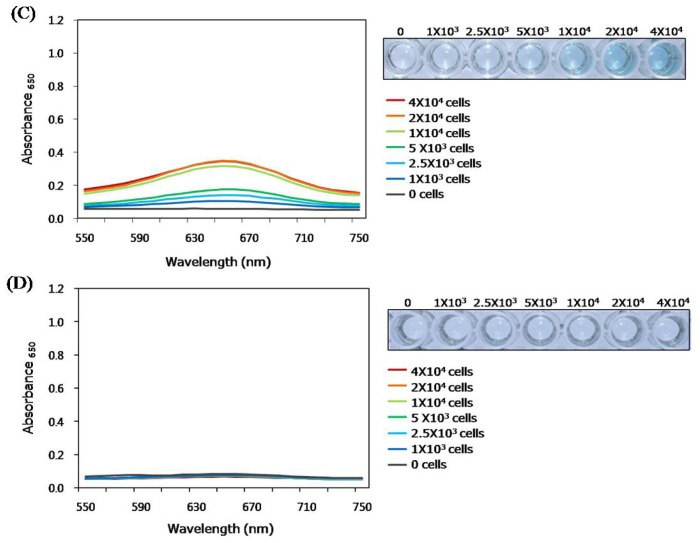
Figure 4.
(A) Absorption spectra (left) and well plate image (right) for immunoassay to colorimetrically detect HER2 obtained from three different cell lines using 4 × 10⁴ cells per well (SKBR-3; HER2-overexpressing cell, MCF-7; weakly HER2-expressing cell, and H520; HER2-negative cell). Absorption spectra (left) and corresponding images of well plates (right) for the immunoassay to detect HER2 obtained from the increasing amount of (B) SKBR-3 cells; (C) MCF-7 cells; and (D) H520 cells.


