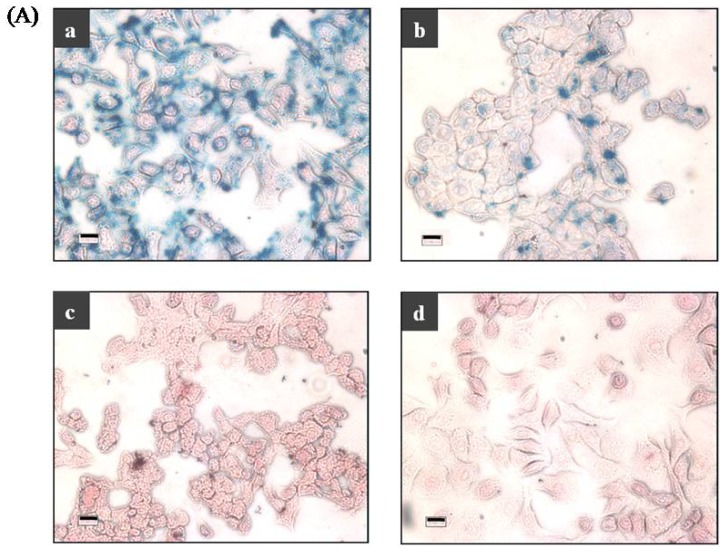
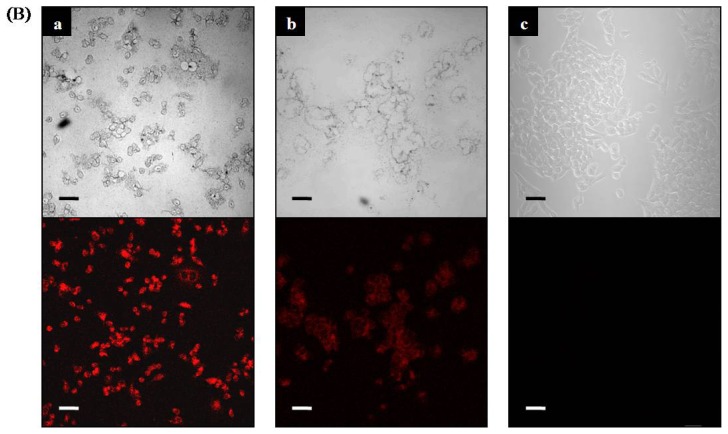
Figure 5.
(A) Optical microscope images after Prussian blue staining of SKBR-3 cells incubated with MNP-Abs; A-a, MCF-7 cells incubated with MNP-Abs; A-b, H520 cells incubated with MNP-Abs; A-c, and only SKBR-3 cells; A-d, (scale bar = 20 μm); (B) Fluorescent visualization by utilizing tyramide signal amplification generated by the intrinsic peroxidase activity of MNP-Abs applied to SKBR-3 cells; B-a, MCF-7 cells; B-b, and H520 cells; B-c, Upper and lower images are bright field optical images and cy5 fluorescence images, respectively (scale bar = 40 μm).


