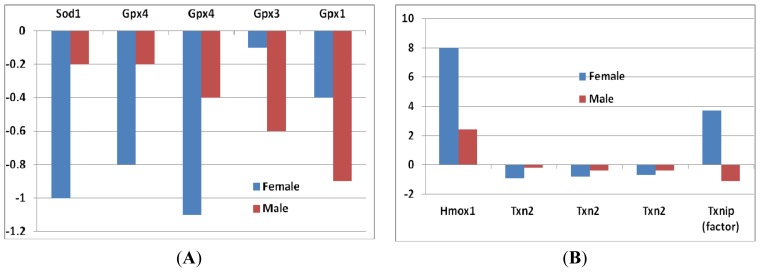
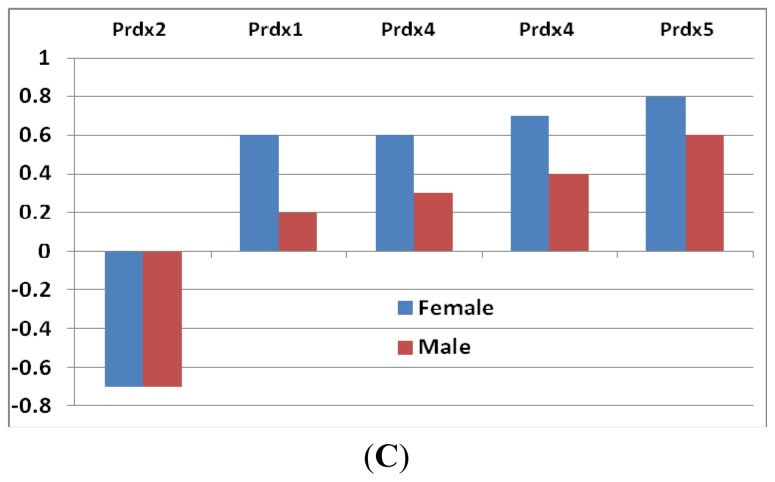
Figure 2.
Fold changes of expression levels of antioxidative enzymes genes in female and male mice between sfx and WT mice. Y-axis indicates the fold changes in comparison to WT BALB/c mice. (A) The expression levels of superoxide dismutase 1 (Sod1) and glutathione peroxide (Gpx1, Gpx3, Gpx4); (B) The expression levels of Heme oxygenase and Thioredoxins in sfx mice; (C) The expression levels of peroxiredoxins in sfx mice. (A) (B)


