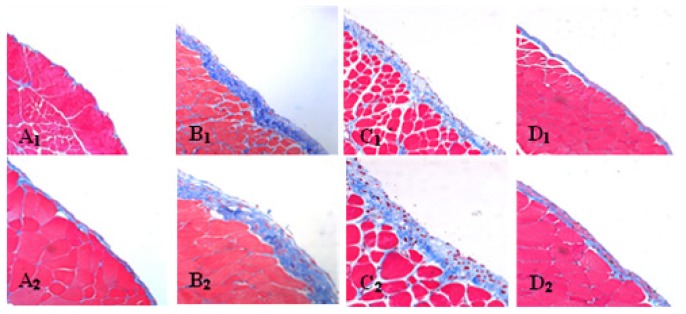
Figure 5.
Representative photomicrographs (original magnification: ×200) of Masson’s trichrome staining in the (A1) NC group, (B1) PF group, (C1) LP group and (D1) LC group. Representative photomicrographs (original magnification: ×400) of Masson’s trichrome staining in the (A2) NC group, (B2) PF group, (C2) LP group and (D2) LC group.

