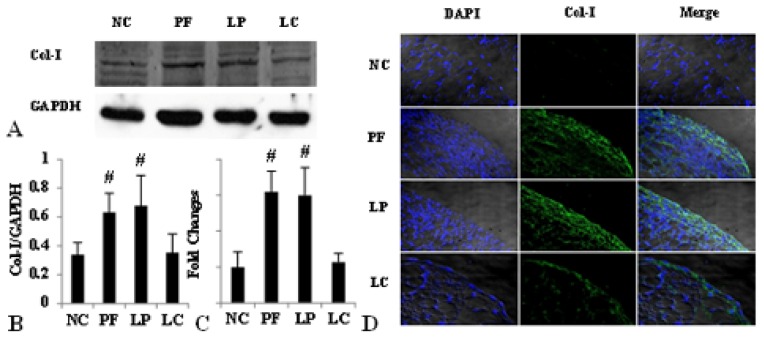
Figure 6.
LC depressed Col-I deposition via depletion of peritoneal M2. Values were expressed as the mean ± SD. (A) The overexpression of Col-I induced by Lactate-4.25% dialysate was evidently downregulated by LC treatment measured by Western blotting; (B) The relative protein level of Col-I normalized by GAPDH; (C) The mRNA level of Col-I was depressed by LC treatment; (D) Immunofluorescence staining of Col-I in the four groups. Blue corresponds to nuclear staining; green corresponds to Col-I staining. #p < 0.05, vs. NC and LC group.

