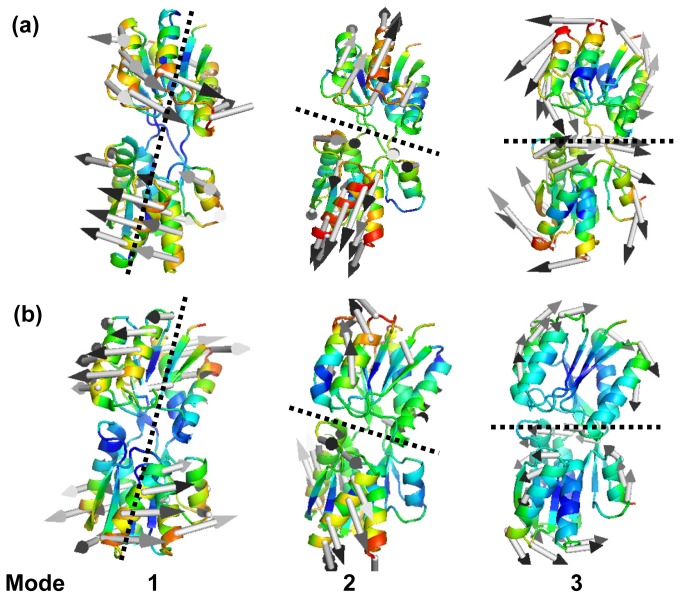
Figure 5.
Mean-square fluctuations of the three slowest Anisotropic Network Model (ANM) modes are color mapped on to the (a) open and (b) closed conformations of RBP. Two structures have the similar motion status in the three slowest ANM modes. The longitudinal and transverse axes are shown with the dashed black lines in the figures, which represents the hinge rotation axis. Mode 1 is a rotation motion of the two domains around the hinge rotation axis. In the mode 2, the two domains open and close with respect to each other. In the mode 3, the two domains make a twisting motion. The arrows indicate the direction of fluctuations. The figures were generated using the program PYMOL.

