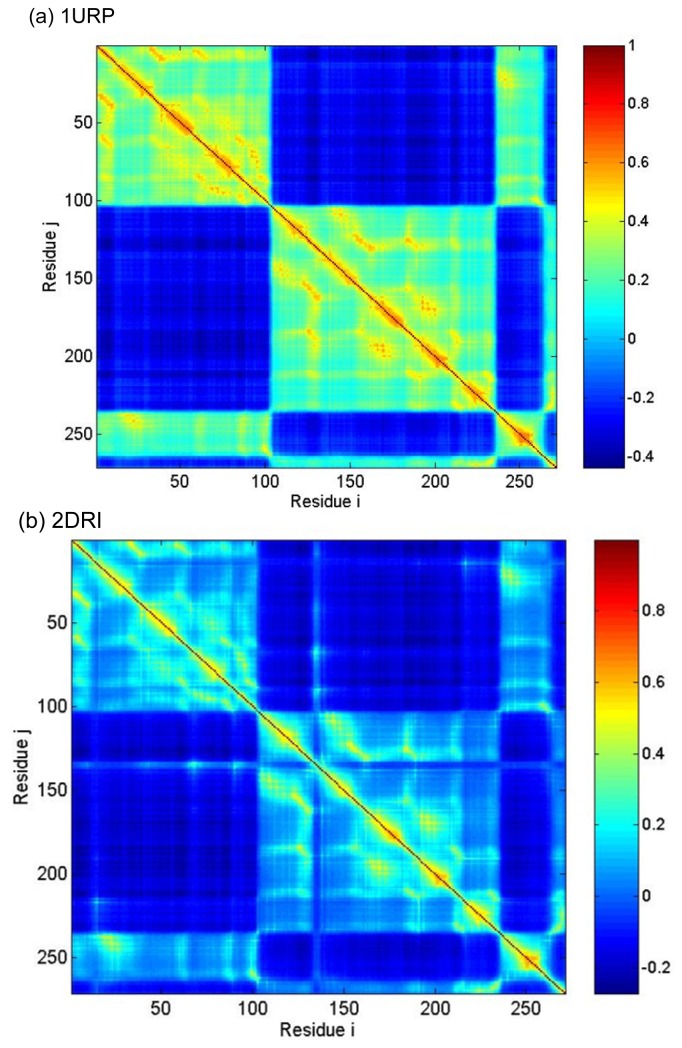
Figure 7.
Cross-correlations map between residue fluctuations (a) 1URP and (b) 2DRI: The two axes refer to residue indices, and the colors indicate different strengths and types of interresidue orientational correlation functions [Equation (6)]. Blue and red regions correspond to negatively (opposite direction) and positively (same direction) correlated motions, respectively.

