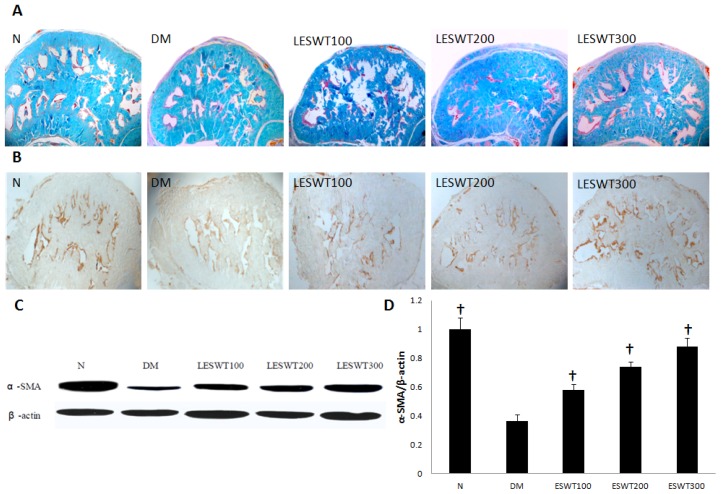
Figure 3.
Smooth muscle contents in corpus cavernosum. (A) Masson trichrome staining. Smooth muscle manifested as red, connective tissue was green; (B) The expression of α-SMA by immunohistochemistry staining; (C) Western blot of α-SMA; (D) The ratio of α-SMA to β-actin by Western blot. Each bar depicts the mean values (± standard deviation) from N = 5 (immunohistochemical staining) and N = 3 (Western blots) animals per group. †p < 0.01 compared with the DM group.

