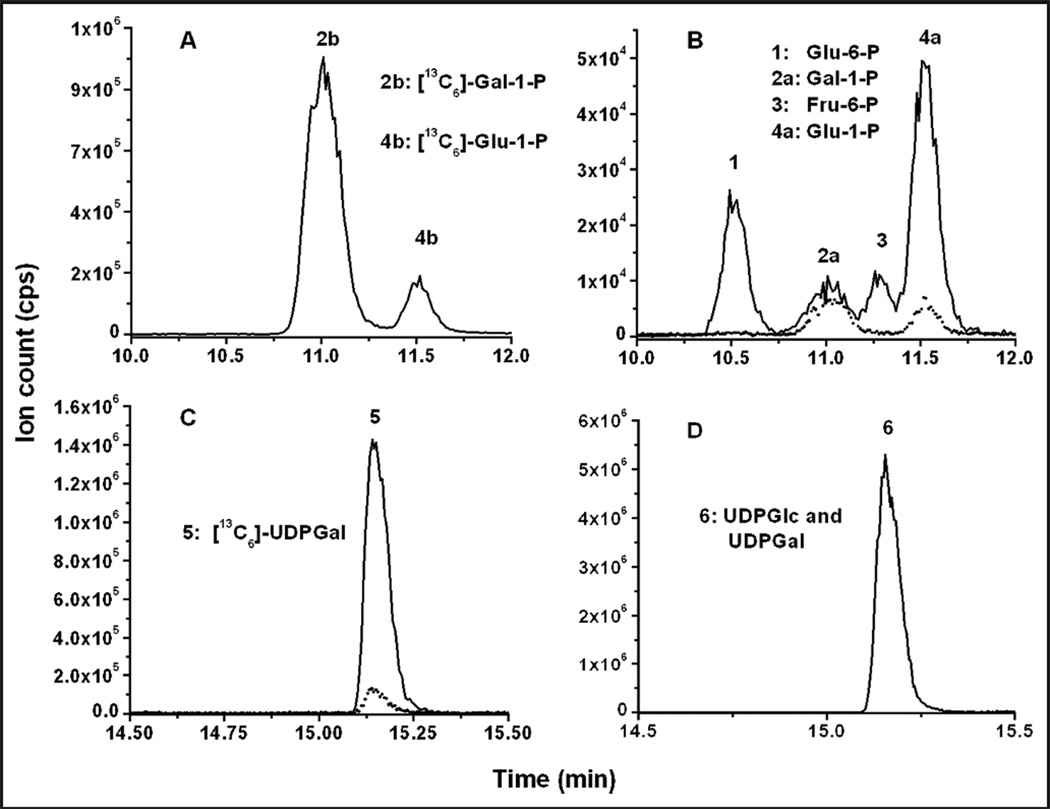
Fig. 1. LC-MS/MS chromatograms of GALT assay.
(A), (B), (C), and (D) are the LC-MS/MS chromatograms of MS/MS transitions 265 > 79, 259 > 79, 571 > 323, and 565 > 323, respectively, of a control sample analyzed with a standard assay procedure. (A), The 2 peaks (MS/MS transition 265 > 79) are enzyme substrate [13C6]-Gal-1-P (peak annotated as 2b) and IS (4b). (B), Four major peaks are shown (259 > 79). They are, from left to right, Glu-6-P, Gal-1-P, fructose-6-phosphate (Fru-6-P), and Glu-1-P. The dashed line represents the chromatogram of the blank assay of the same sample. The peaks for Glu-1-P and Glu-6-P in the standard assay, particularly the latter, were substantially increased compared to the blank assay because of the formation of Glu-1-P in the reaction and the subsequent conversion of Glu1-1-P to Glu-6-P by endogenous phosphoglucomutase. (C), The enzymatic product ([13C6]-UDPGal) (571 > 323). As shown, there was a little [13C6]-UDPGal peak (<10% of the standard assay) in the blank assay (dashed line). Dashed lines in (B) and (C) represent the chromatograms of the blank assay (i.e., the assay mixture was boiled at time 0) of the same sample. The chromatograms of the blank assay In (A) and (D) are not shown.

