Figure 2.

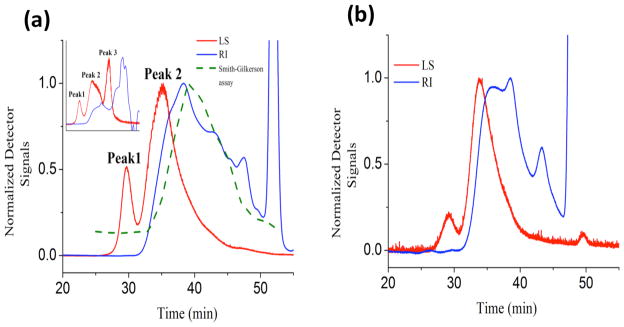
a) Elution chromatograms of PIA isolated by sonication. The chromatograms from the light scattering (LS) detector and from the refractive index (RI) detector are in red and blue respectively. Amino sugars were detected only in Peak 2 (by the Smith-Gilkerson assay) 26. Eluting fractions beyond 50min are peaks caused by electrolyte in the mobile phase.
b) The elution chromatogram of isolated Peak 2, containing only amino sugars. This sample represents high purity PIA that was used for all further analysis.
