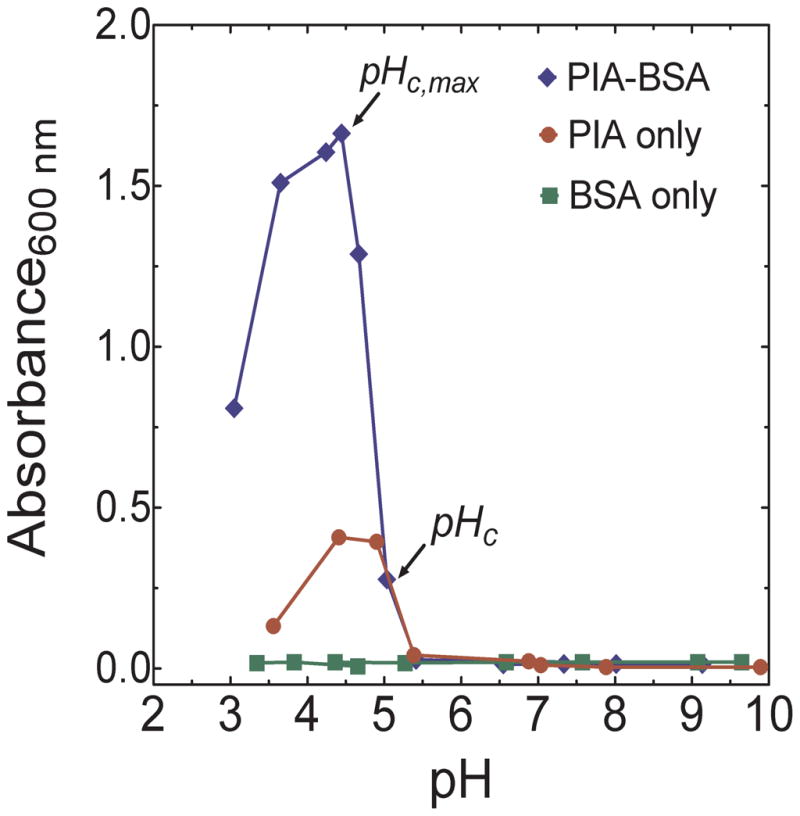
Figure 5.

Absorbance (at 600 nm) versus pH for solutions of PIA-BSA (6.4 × 10⁻⁴ g/mL PIA, 0.5 %(w/v) BSA) and solutions containing only PIA (6.4 × 10⁻⁴ g/mL) and only BSA (0.5 %(w/v)). The absorbance curve of PIA is consistent with its scattering behavior whereas BSA shows no significant change in absorbance at the concentration studied.
