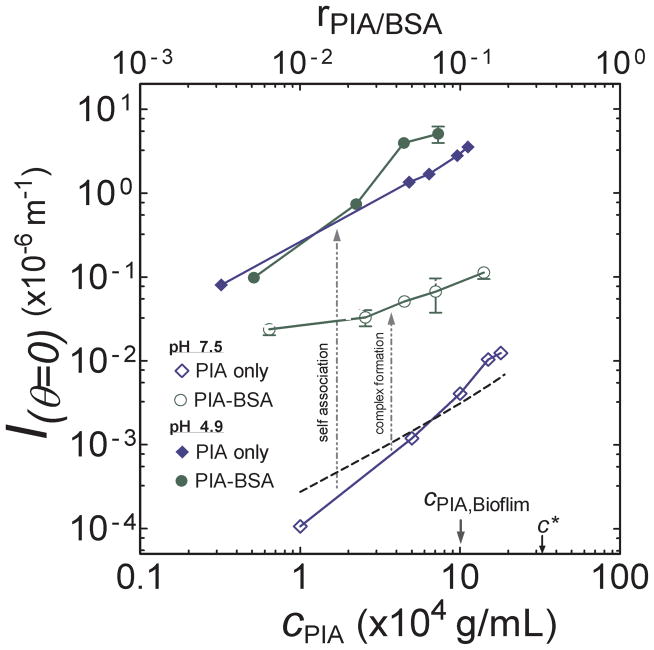
Figure 7.
Scattering intensity at zero angle (Iθ=0) versus PIA concentration (cPIA) at different pH. Solid and empty diamonds indicate solutions containing PIA only at pH 4.9 and 7.5, respectively. Circles indicate PIA-BSA solutions containing 0.5 %(w/v) BSA and varying concentrations of PIA at pH 4.9 (solid circles) and pH 7.5 (empty circles). The dotted line is the theoretical Zimm curve 27 calculated using the Mw and A2 measured from Figure 6. cPIA,Biofilm and c* are marked for reference. The upper x-axis denotes the molar ratio of PIA to BSA, rPIA/BSA, in each experiment.

