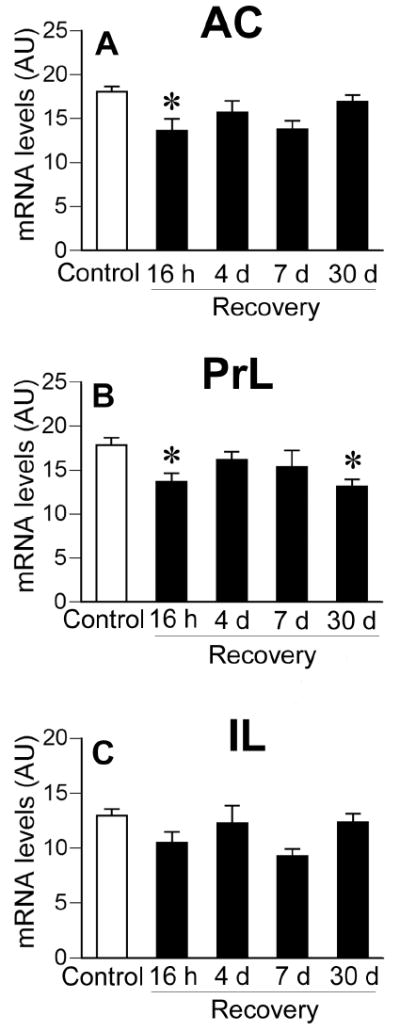
Figure 5.

Semi-quantitative analysis of c-fos mRNA expression in the anterior cingulate cortex (A), prelimbic cortex (B), and infralimbic cortex (C) of Control or CVS groups. CVS groups exposed to novel environment stress exhibited lower levels of c-fos mRNA expression in the anterior cingulate cortex (16 h time point) and prelimbic cortex (16 h and 30 d time point). Individual Control groups were combined to form a large single Control group for graphical presentation purposes. Data are expressed as mean ± standard error of the mean; n = 22-24 for Control group, n = 6 for CVS groups; * = P < 0.05 versus Control group. AU = arbitrary units; other abbreviations are as in Figure 2.
