
Figure 4. Different regional expression of GLT1a and GLT1b in hippocampal subfields.
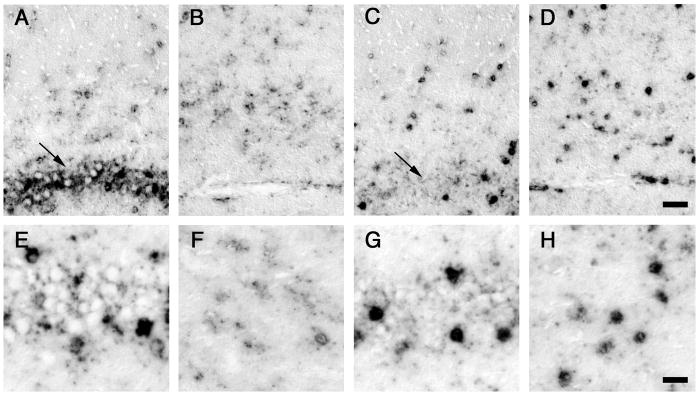
GLT1a (A, B, E, F) and GLT1b (C, D, G, H) mRNA expression levels in astrocytes in CA1 pyramidal cell layer (A, C, E, G) and CA1 molecular layer (B, D, F, H). GLT1a labeling shows a higher intensity in astrocytes within the pyramidal cell layer (arrows) than in astrocytes in the molecular layer. In contrast, GLT1b labeling does not show a distinct difference in intensity between these two regions. These results suggest that GLT1a and GLT1b mRNA expression is differentially regulated. Bars: D, 50 μm; H, 25 μm.