
Figure 1.
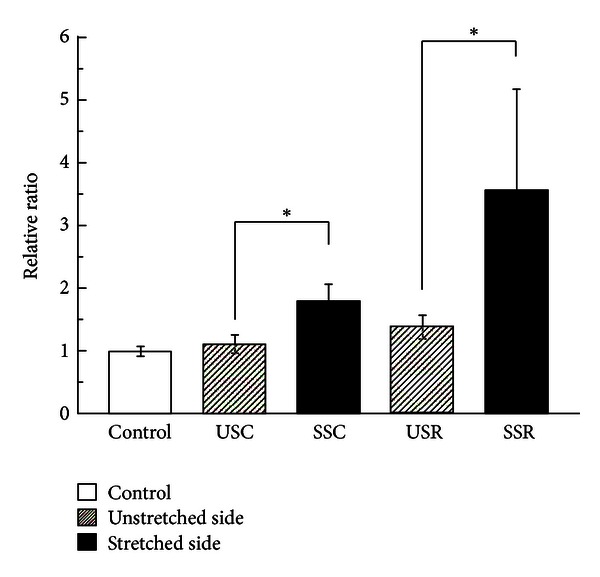
MyoD mRNA expression. Relative ratio of MyoD mRNA expression induced under different stretching conditions (mean ± SE). The open bar shows the control group; shaded bars denote the unstretched side of continuous stretching and repetitive stretching; and filled bars denote the stretched side of continuous stretching and repetitive stretching. Significant differences were displayed (*P < 0.05).