
Figure 1.
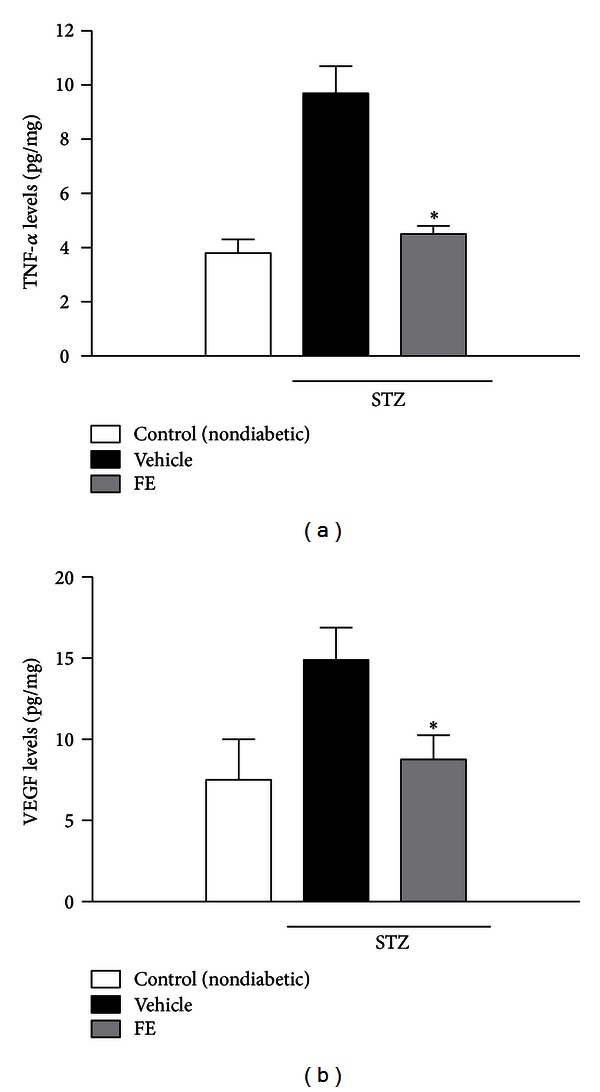
Retinal levels of TNF-α (a) and VEGF (b) 10 days after STZ injection with or without FE treatment. Data are expressed as the mean ± SD. *P < 0. 001 versus vehicle (n = 8–10).
Official websites use .gov
A
.gov website belongs to an official
government organization in the United States.
Secure .gov websites use HTTPS
A lock (
) or https:// means you've safely
connected to the .gov website. Share sensitive
information only on official, secure websites.
Retinal levels of TNF-α (a) and VEGF (b) 10 days after STZ injection with or without FE treatment. Data are expressed as the mean ± SD. *P < 0. 001 versus vehicle (n = 8–10).