
Fig. 1.
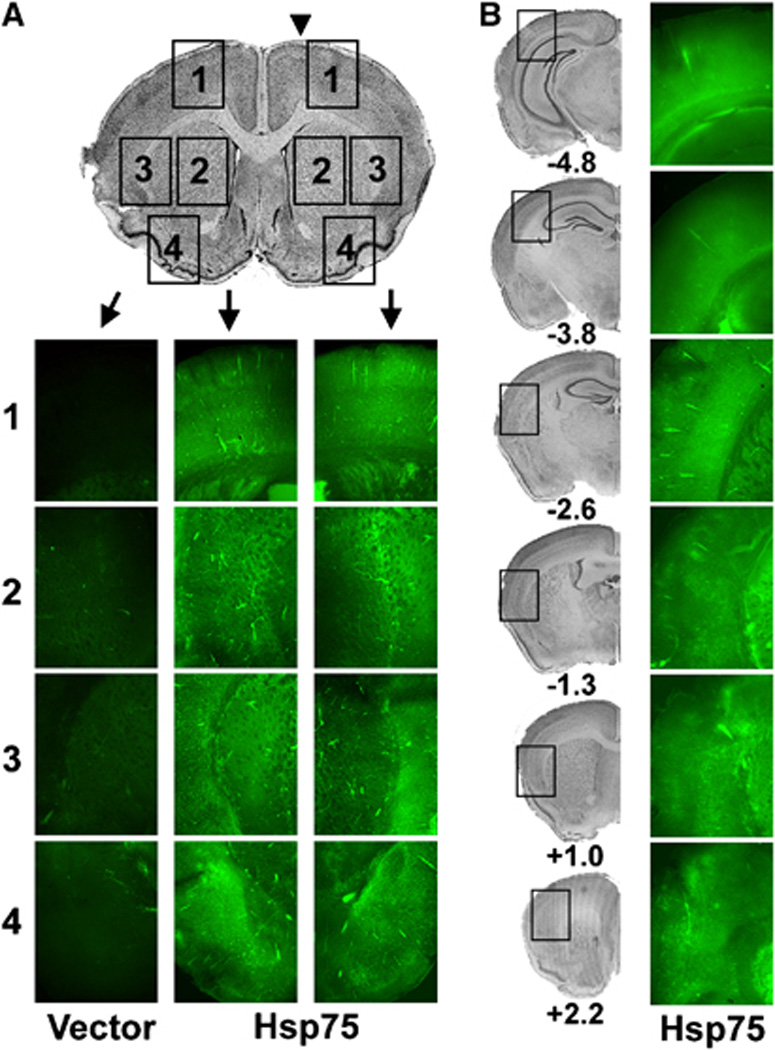
Distribution of Hsp75 protein expression after unilateral intraventricular injection of plasmid (indicated by arrow head in A). (A) Hsp75 immunofluorescence (green) contralateral (left two columns) and ipsilateral to the injected ventricle (right column) from approximate regions indicated on the cresyl violet stained brain section shown at the top. (1) Superior cortex including primary motor cortex (penumbral area), (2) striatum (infarct area), (3) medial cortex plus lateral striatum (infarct and most protected area), and (4) inferolateral cortex (seldom included in infarct area) in both vector- and Hsp75-injected brain slices. Photomicrographs were taken at the same fluorescence exposure for vector- and Hsp75-injected brains. (B) Hsp75 fluorescence from representative coronal sections at different levels relative to bregma of an Hsp75 injected brain. Left column of cresyl violet stained sections indicates the approximate regions from which the images in the right column were taken.