
Figure 2.
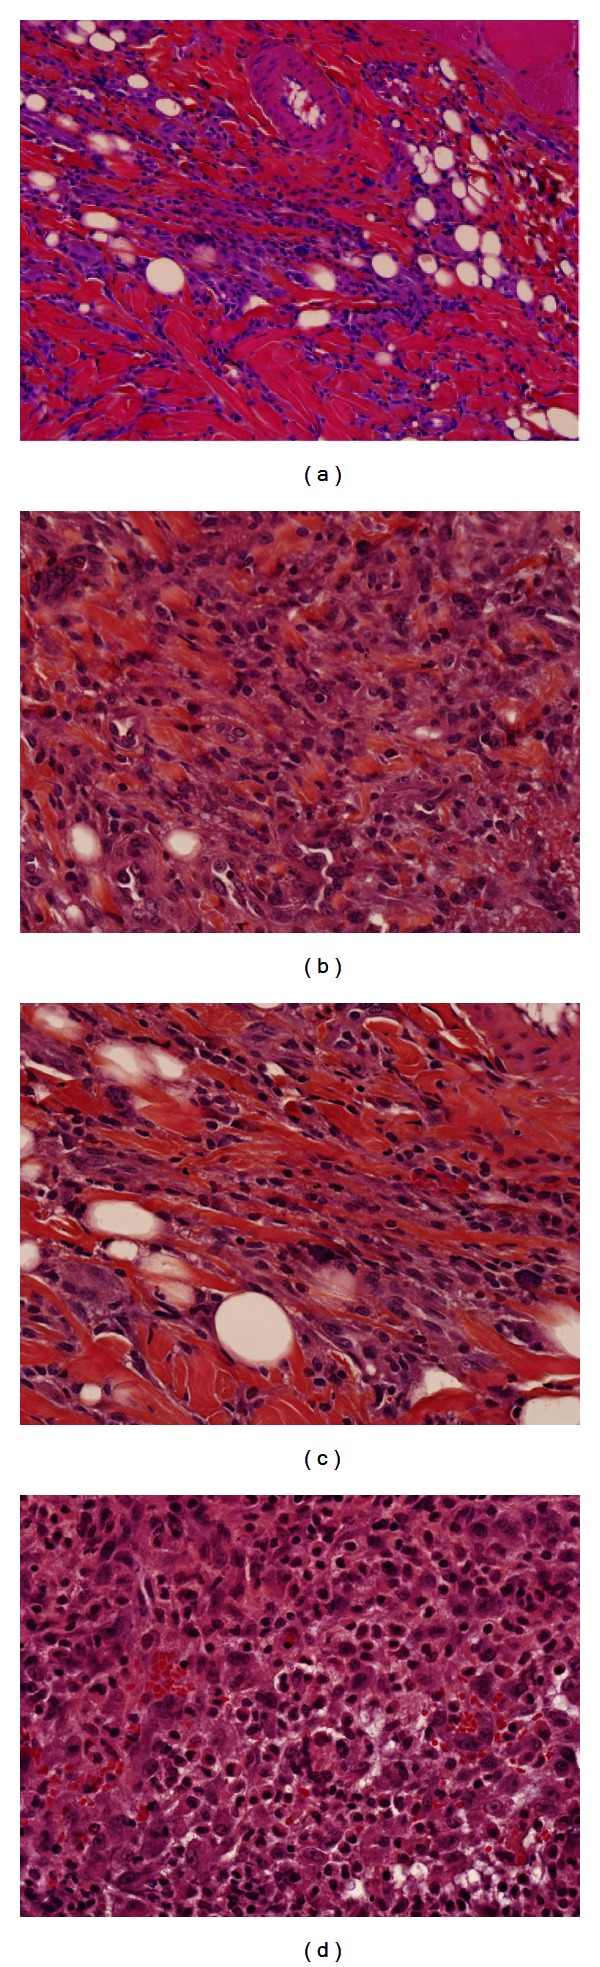
Histological imaging of control and experimental wounds stained with H&E. Blue represents nuclear staining. (a) 20x magnification of a representative control wound at Day 3; (b) 20x magnification of a representative C3C5-treated wound at Day 3; (c) 40x magnification of a representative control wound at Day 3; (d) 40x magnification of a representative C3C5-treated wound at Day 3. There is an increased cellular infiltration in the experimental wounds ((b) and (d)) as compared to control wounds ((a) and (c)) as represented by an increased inflammatory cell nuclear staining. It is evident that an increased extent of inflammation in the C3C5-treated wound beds exists as seen in the lower-power images. There is also an obvious increased collagen deposition and organization in the experimental wounds as seen in higher power images.