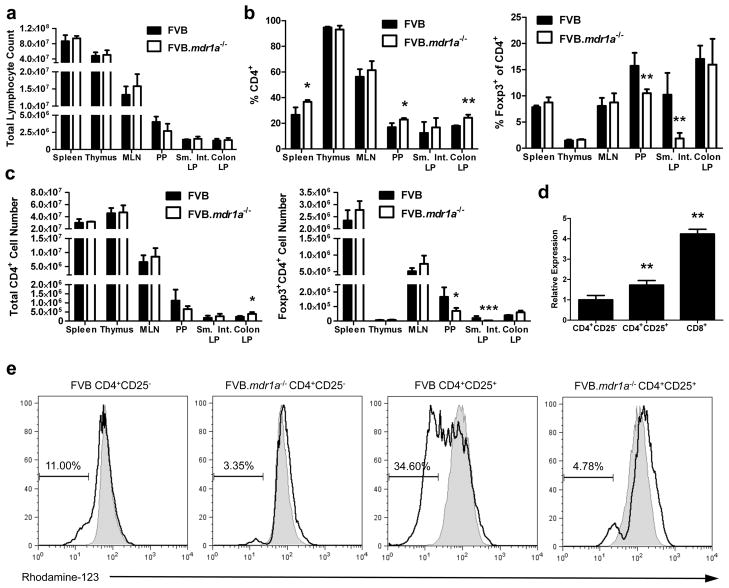
Figure 1.
CD4+CD25+ cells express P-glycoprotein and FVB.mdr1a−/− mice display a smaller percentage of CD4+Foxp3+ Treg cells in intestinal lymphoid tissues. (a) Total cell lymphocyte counts after cell isolation. (b) Total percentage of CD4+ and Foxp3+CD4+ cells from FVB and FVB.mdr1a−/− spleen, MLN, Peyer’s patches (PP), and small intestinal (Sm. Int.) or colonic lamina propria (LP). Cells were collected from tissues and rested overnight prior to staining and flow cytometry. (c) Total cell numbers of CD4+ or CD4+Foxp3+ cells within each population. (d) RNA expression of Abcb1a (P-gp) in splenic CD4+CD25− (set as a relative value of 1.0), CD4+CD25+, and CD8+ (known to express P-gp) splenocytes. (e) P-gp functional expression on CD4+CD25− and CD4+CD25+ cells. MACS isolated cells were loaded with the P-gp specific substrate rhodamine-123 (R123) for 1 hour, followed by a 1 hour flux of R123. Shaded region represents loading control, while solid line indicates fluxed sample. Percentages indicate percent of cells fluxing R123 through P-gp activity. Small amount of flux is a result of free diffusion of R123 across cell membrane. Data are representative of 2 (d) or 3 (a, b, and c) separate experiments, with 3–4 male mice, 6–8 weeks of age in each group per experiment. * P ≤ 0.05; ** P ≤ 0.01. Mean + standard deviation shown.

