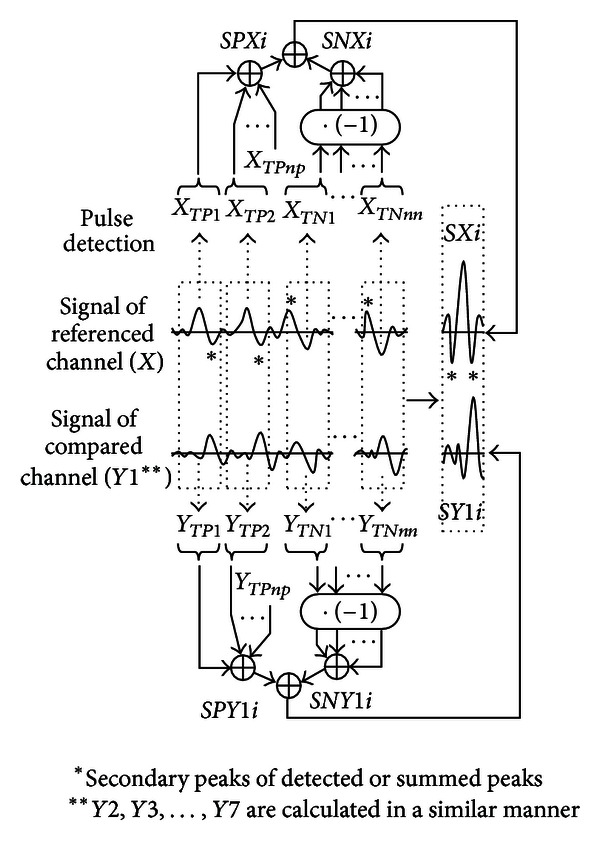
Figure 3.

Schematic diagram of computation procedure. TP1, TP2,…, and TP npare the points of peaks detected by X. The time difference between X and Y1 is shown by the summed signals SXi and SYi. Notice that the secondary peaks before and after the summed peaks are smaller than the central peak in SXi (“∗” in SXi) because the summed signal of negative peaks are also summed after the reversed calculation (calculation of the signal “· (−1)”). The simultaneously summed signal from the compared channel (SY1i) shows a similar waveform, but the phase is shifted from SXi.
