
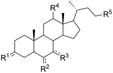
Table 1. Structure-activity relationship data for lithocholic acid derivatives.
| ||||||
|---|---|---|---|---|---|---|
| Cpd. | R1 | R2 | R3 | R4 | R5 | Ki (μM)[a] |
| 1 |
|
|
|
|
|
49±3.0 |
| 2 |
|
|
|
|
|
>200 |
| 3 |
|
|
|
|
|
>200 |
| 4 |
|
|
|
|
|
>200 |
| 5 |
|
|
|
|
|
114±13 |
| 6 |
|
|
|
|
|
138±20 |
| 7 |
|
|
|
|
|
157±47 |
| 8 |
|
|
|
|
|
114±14 |
| 9 |
|
|
|
|
|
88±11 |
| 10 |
|
|
|
|
|
25±4.0 |
| 11 |
|
|
|
|
|
>200 |
| 12 |
|
|
|
|
|
5.1±1.4 |
| 13 |
|
|
|
|
|
>200 |
| 14 |
|
|
|
|
|
>200 |
| 15 |
|
|
|
|
|
>200 |
| 16 |
|
|
|
|
|
186±27 |
[a]
Values are means ± standard error from at least three independent experiments