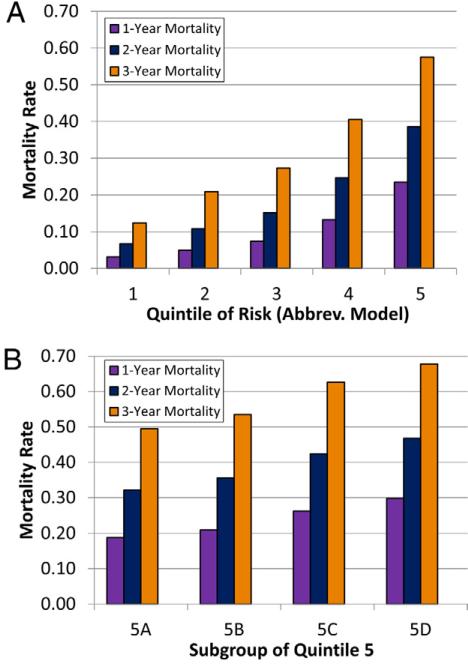
Figure 4. Mortality Rates by Quintile of Risk Score in the Validation Cohort.
The mortality rates at 1, 2, and 3 years in the validation cohort on the basis of quintile of the nomogram-based risk score are shown (A). In addition, mortality rates are also shown, with the highest quintile split into 4 groups in ascending order of risk (B). Group 5A represents percentiles 80 to 84, while group 5D represents percentiles 95 to 99.

