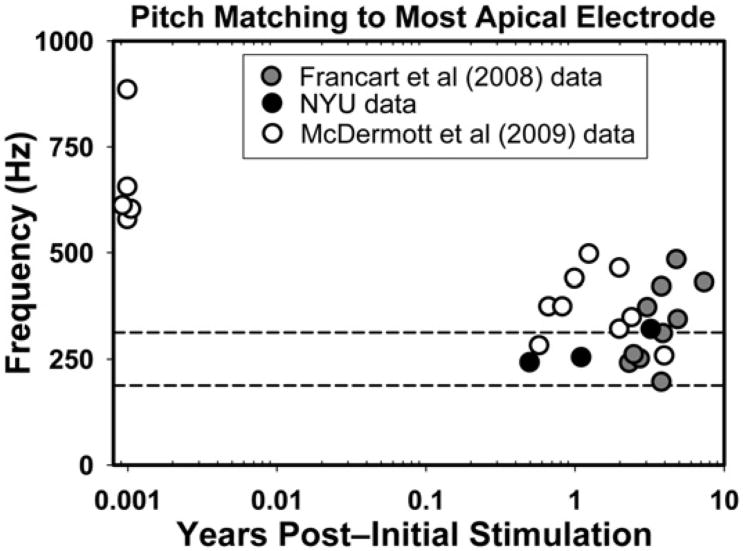
Figure 3.
Average pitch-matched frequency of acoustic tones for the most apical electrode in 27 users of the Nucleus-24 CI, as a function years of listening experience with the CI. The y-axis corresponds to the acoustic pitch matches (in Hz), and the x-axis depicts the number of years after initial stimulation (on a logarithmic scale). The two horizontal dashed lines show the frequency range that is associated with the most apical electrode in Nucleus-24 users: 188–313 Hz with a 250 Hz center frequency. Values within this range are considered to reflect complete adaptation to any frequency mismatch and are reflected by symbols that fall within the two dashed lines. Symbols above this region represent basalward shift, a situation where the percept elicited by a given electrode is higher in frequency (i.e., a more basal cochlear location) than the electrode's analysis filter.

