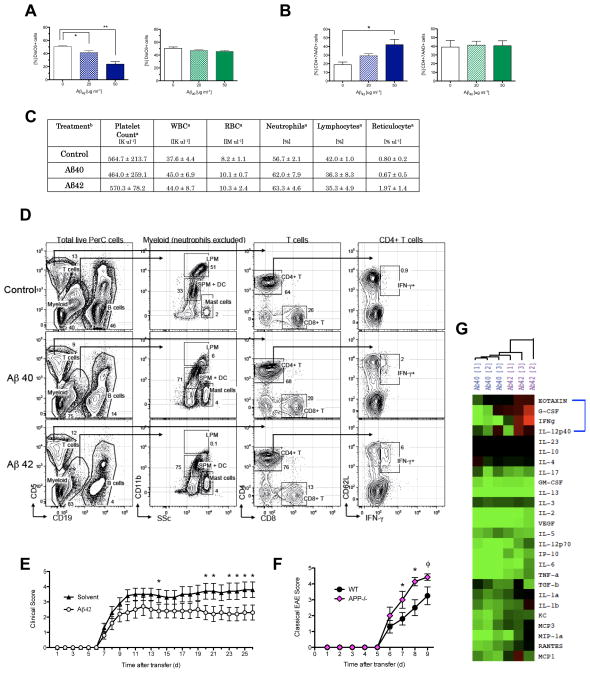
Fig. 4. Aβ42 and Aβ40 differentially modulate peripheral immune cells during EAE.
(A) Quantification of frequency of viable mouse CD4+ T-cells expressing DioC6high cultured with Aβ42, Aβ40, or solvent control (50 ug ml−1). Mouse splenocytes activated in vitro with αCD3 (1 ugml−1). Representative of 48 and 72 h stimulation of three separate experiments. Error bars show s.e.m. (n=3 per group). (* P < 0.05; ** P < 0.01). (B) Frequency of nonviable (7-AAD+) human CD4+ T-cells treated with Aβ42or Aβ40. PBMCs collected from blood of healthy human donors. Activated by αCD3 αCD28 αCD2 stimulation for 5 d. (* P < 0.04) (Ca) Table of values presented as the mean ± s.d.. (Cb) Treatment denotes in vivo administration of Aβ42, Aβ40 or solvent control initiated two days prior to EAE-immunization and continuing three times per week (300 ug ml−1) in prevention model. Sera extracted 10 days post EAE induction (n=3 mice per treatment group). White Blood Cells (WBC), Red Blood Cells (RBC). (D) Gating strategy used to identify immune cells present in PerC based on surface molecules. Total PerC cells from Control, Aβ40- and Aβ42- treated EAE mice at the peak of disease were processed and analyzed as described in Materials and Methods. Data shown are representative of n = 4 mice per group. (E) Peripheral immune cells taken from MOG-immunized donor C57BL/6 mice treated with Aβ42 or solvent control for 10 days and adoptively transferred into untreated naïve recipient C57BL/6 mice. EAE induced adoptively in naïve recipients is shown as mean clinical score (n=10 per group) (* P < 0.05). (F) Mean clinical scores of Th17-induced EAE in WT and APP−/− mice (n=7–8 per group). (ϕP < 0.08, * P < 0.05). Error bars represent means ± s.e.m. (G) Cytokine profiles from EAE-induced mice treated with Aβ42 (purple) or Aβ40(blue) in prevention model. Sera collected from peripheral blood on EAE Day 10. Relative cytokine depicted as the difference in relation to control EAE mice. Samples analyzed by hierarchical clustering and shown as a heat map where red represents increased amounts, black represents similar amounts, and green represents decreased amounts of cytokine compared to solvent-treated EAE controls. The blue bracket highlights the four analytes – Eotaxin, G-CSF, IFN-γ, IL-12p40, that are most prominently differentially regulated between Aβ treatments.

