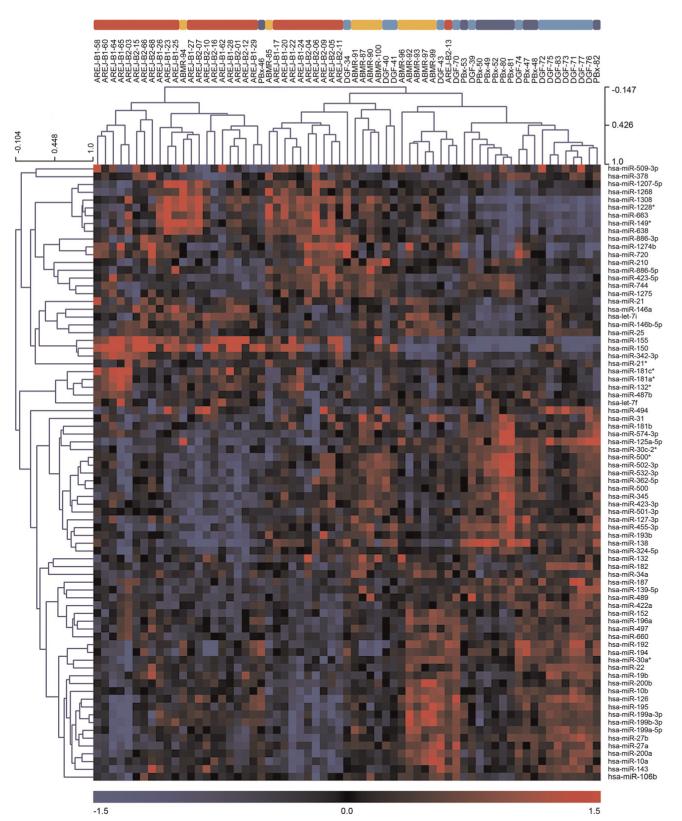
FIGURE 1.
Unsupervised clustering of miRNAs with high variance (top 20%, 80 miRNAs); AREJ (red), ABMR (orange), DGF (light blue), and PBx (blue). The heat map was produced using clustering of rows (miRNA expression values) and columns (samples) of the data matrix using the complete linkage algorithm and Pearson correlation. (left) miRNA clustering tree; (top) sample clustering tree. The samples are clustering broadly into two groups: rejection and no rejection. (bottom) The color scale illustrates the relative expression level of the indicated miRNA across all samples: (red) expression>0 and (blue) expression<0. ABMR, antibody-mediated rejection; AREJ, acute cellular rejection; DGF, delayed graft function; miRNA, microRNA; PBx, protocol biopsy.

