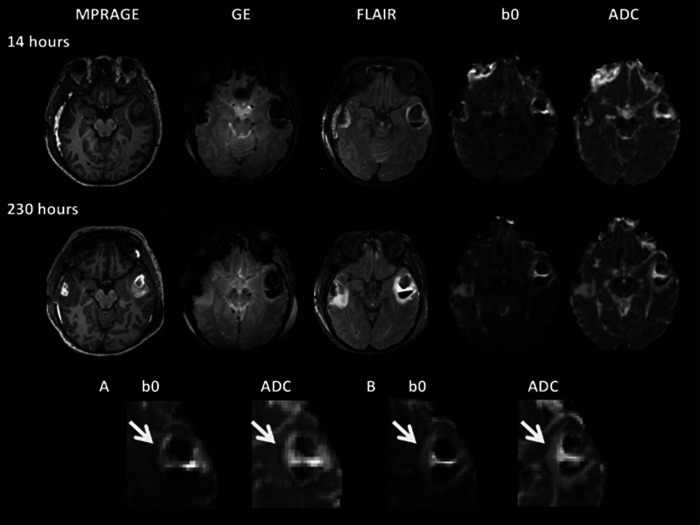
Figure 4.
Example of change in a contusion over time in a 49-year-old female with severe traumatic brain injury (TBI) (GCS 5) after a road traffic collision. The T1-weighted image (magnetization-prepared rapid gradient echo, MPRAGE), gradient echo (GE), fluid-attenuated inversion recovery sequence (FLAIR), T2* (b0), and apparent diffusion coefficient (ADC) maps for each time point are shown. The top two panels illustrate progression of contusions from approximately 14 hours after injury (top) to 230 hours after injury (second panel), respectively. Overall contusion growth and increase in the volume of the bright ‘vasogenic' rim on the ADC map can be seen. Magnified views of the T2* (b0) and ADC maps are shown in the bottom panel (A and B). At the earlier scan (at 14 hours, A), a vasogenic rim is surrounded by a hypointense rim that can clearly be seen on the ADC map (white arrow). The hypointense area corresponds to an area of low-signal intensity on the T2* (b0) map, which does not correspond to the presence of blood degradation products on the gradient echo. Classical cytoxic edema is bright on DWI (T2 shine through) and hypointense in parametric ADC maps. The discordance seen here may be secondary to hemoglobin desaturation in ischemic tissue, which is the consequence of reductions in blood flow before it evolves to infarcted tissue.

