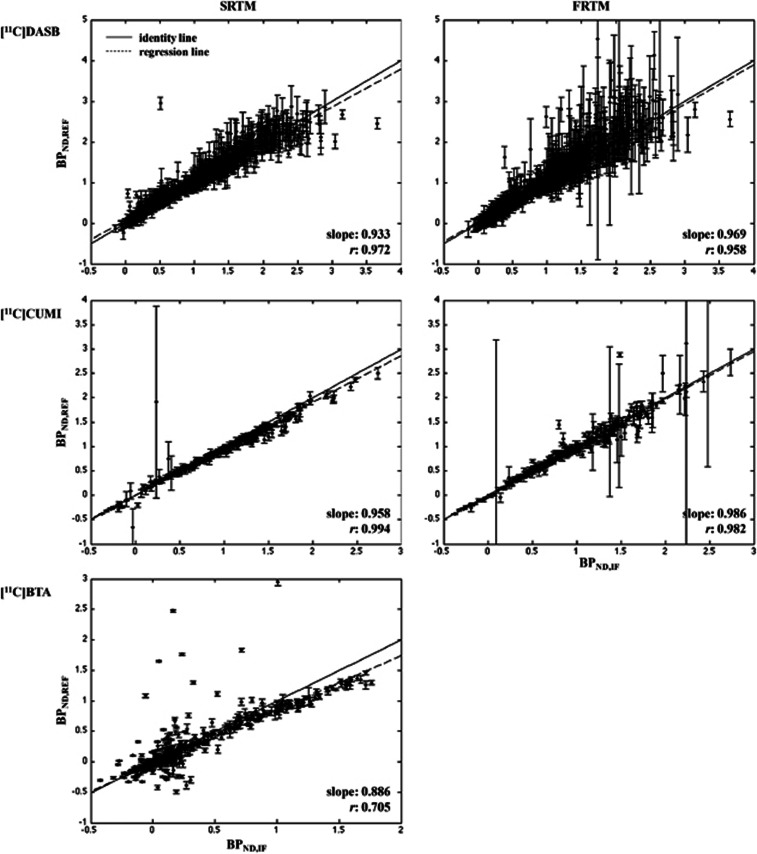
Figure 2.
Region of interest (ROI) analysis: simplified reference tissue model (SRTM) and full reference tissue model (FRTM). Scatter plots of BPND,IF (X-axis) and BPND,REF (Y-axis) for [11C]DASB (top; 209 × ROIDASB=1,254 cases), [11C]CUMI (middle; 22 × ROICUMI=286 cases), and [11C]BTA (bottom; 74 × ROIBTA=444 cases). The X-axis is the full cIF analysis (LEGA for [11C]DASB and [11C]CUMI; Logan for [11C]BTA). In each plot, the identity (solid) and the weighted regression (dashed) lines are reported. Each point bars represent the standard error (SE) of the corresponding BPND estimate. BPND, nondisplaceable binding potential; IF, input function; cIF, metabolite-corrected IF; LEGA, likelihood estimation in graphical analysis.

