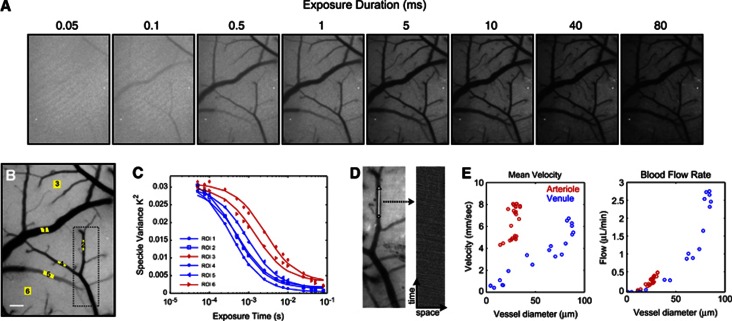
Figure 2.
(A) Representative single-exposure speckle contrast images (15 exposures total, 8 shown). (B) Multi-Exposure Speckle Imaging Inverse Correlation Time (MESI ICT) image of flow computed from 15 exposures. Darker pixels are linearly representative of increasing flow. Scale bar=150 μm. (C) MESI-computed speckle visibility curves for selected regions of interest (ROIs) in (B). Six ROIs selected for correlation time computation: four of which are centered in large surface vessels (blue curves) and two in areas without resolvable vasculature (red curves). (D) Green LED illuminated reflectance image (left) of cortex corresponding to boxed region in (B). Centerline (white, 100 μm) represents region over which red blood cells (RBCs) tracked. RBC time course (right) corresponding to selected vessel's centerline compiled from sequential images (see Supplementary Videos). (E) Extracted mean RBC velocity versus vessel diameter from RBC tracking and corresponding blood flow rate computed from centerline velocities and vessel cross-sections.

