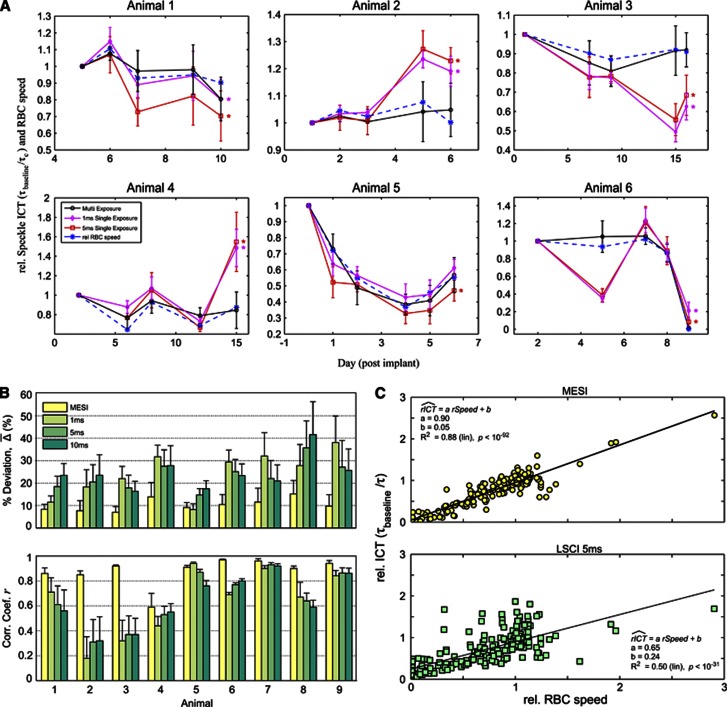
Figure 3.
(A) Chronic baseline imaging of blood flow in six animals over varying durations. Relative inverse correlation times (ICTs) from Multi-Exposure Speckle Imaging (MESI) and Laser Speckle Contrast Imaging (LSCI) (1 and 5 ms exposures) are normalized to the first imaging session. Corresponding relative flow measures from red blood cell (RBC) tracking are included to register baseline flow dynamics with both speckle techniques. Data points and error bars represent avg±s.d. over 4 to 6 vessels specifically enumerated in Table 1. Asterisk denotes statistically significant (*P<0.05, repeated measures analysis of variance) difference between the LSCI and RBC tracking flow trends. Individual vessel and parenchyma flow trends are provided for some animals as Supplementary Information. (B) Average percent deviations (% ) and average correlation coefficients (r) of chronic flow dynamics from MESI and LSCI (1, 5, and 10 ms exposures) against RBC speed changes within each animal. Data and error bars represent avg±s.d. over number of regions of interest (ROIs) and imaging sessions specified in Table. (C) Linear regression of MESI and LSCI (5 ms) predicted flow dynamics versus those from RBC Tracking compiled from all comparison points (n=201) across all animals.

