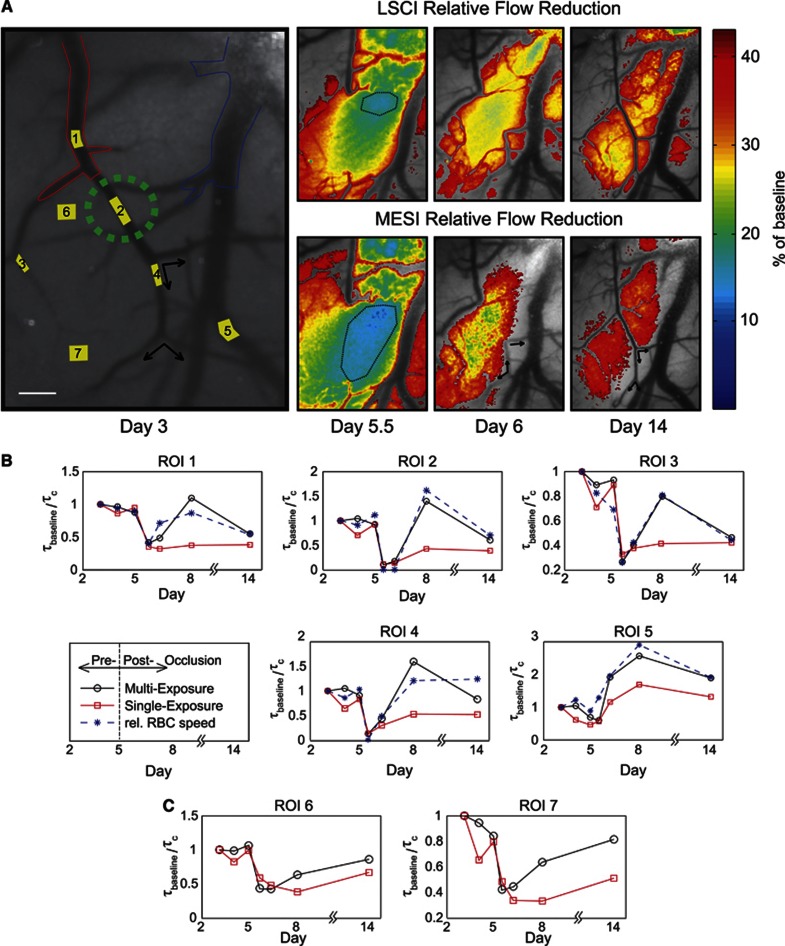
Figure 5.
(A) Speckle contrast image sequence (5 ms exposure) of chronic flow dynamics. Day 3 speckle contrast image corresponds to baseline. Red outline identifies arteriole branch of the anterior cerebral artery and blue outlines highlights neighboring venule. Scale bar=150 μm. Photo-thrombosis site is marked in green. Day 5.5 is the first imaging session after photo-thrombosis. Regional and magnitude variations between 5 ms exposure Laser Speckle Contrast Imaging (LSCI) (top row) and Multi-Exposure Speckle Imaging (MESI) flow predictions (bottom row) after occlusion are shown in overlay over the matching speckle contrast images with a 40% of baseline cutoff. Arrows indicate flow direction from red blood cell (RBC) tracking. Flow at 15% of baseline is demarcated by black outline on Day 5.5 and selections (white box) on Days 6 and 14 depict effect of illumination, sample orientation, and static scattering artifacts specifically on LSCI estimates versus MESI. (B) MESI and LSCI (5 ms) flow dynamics regions of interest (ROIs) over large microvasculature and (C) areas without obvious vasculature corresponding to ROI labels in (A).

