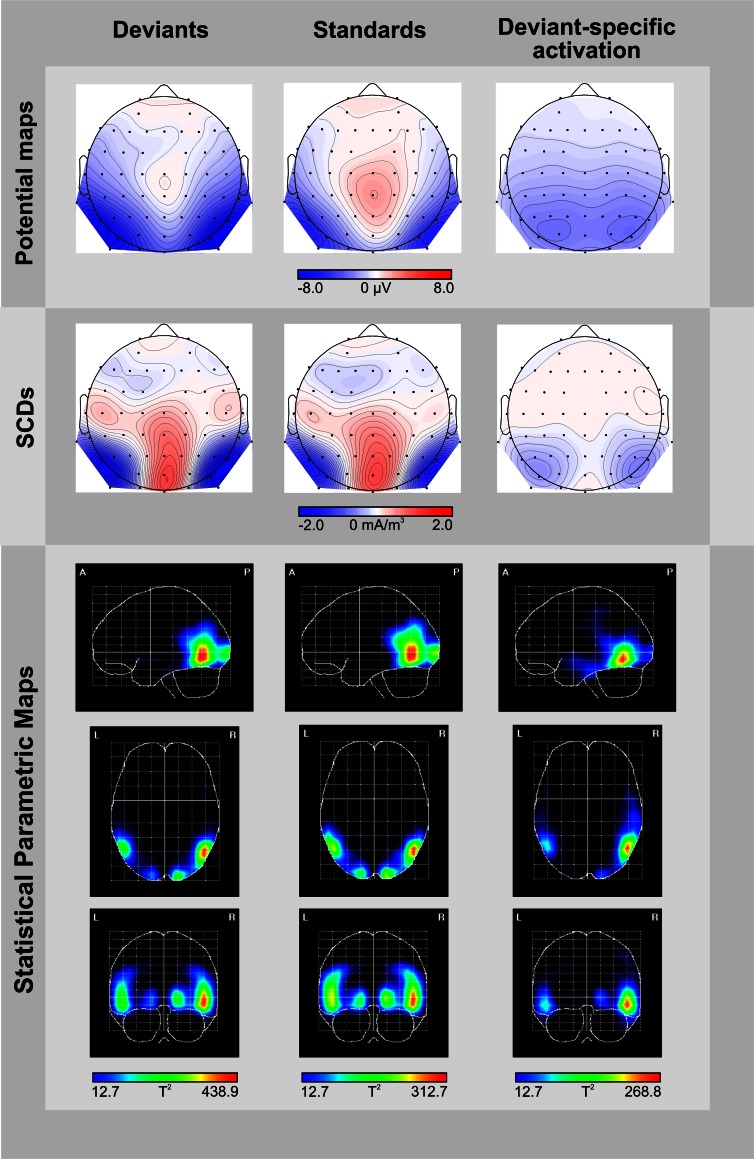
Figure 3.
Topographic and tomographic distribution of ERP-responses elicited by deviants (left column) and standards (middle column), and the corresponding deviant-specific activity (right column) in the 246–280 ms time window. Potential maps (first row) and scalp current density maps (SCDs, second row) are shown with a distance of 0.5 μV and 0.1 mA/m3 between isocontour lines, respectively. To display deviant-specific activity potential maps and SCDs were calculated for the deviant-minus-standard difference waves. A smoothing parameter of lambda = 10−5 was applied to the SCDs. Source localizations computed by VARETA are displayed as statistical parametric maps (third row), thus illustrating the probability of activation within cortical regions (threshold T2 > 12.7 corresponds to a Bonferroni-corrected p < 0.0001). Deviant-specific source localization is displayed as the contrast between the solutions obtained for deviants vs. standards.

