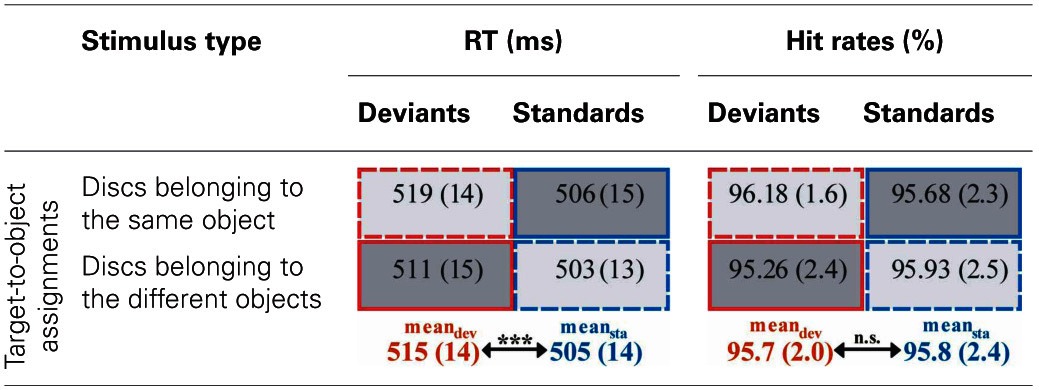
Table 1.
Behavioral performance.

Reaction times (RT) and hit rates are displayed separately for deviant (red outlines) and standard trials (blue outlines) for the two target-to-object assignments, respectively. SEM are given in parentheses. Cells containing responses given within one experimental condition are marked by identical gray-scale and line-style (dark-gray cells with solid outlines correspond to the “same-object-standard-condition,” light-gray cells with dashed outlines correspond to the “different-object-standard-condition”). Responses given to physically identically deviants and standards are contrasted line-by-line. Asterisks indicate significant differences between deviant- and standard-responses averaged over the two target-to-object assignments (***p < 0.001).
