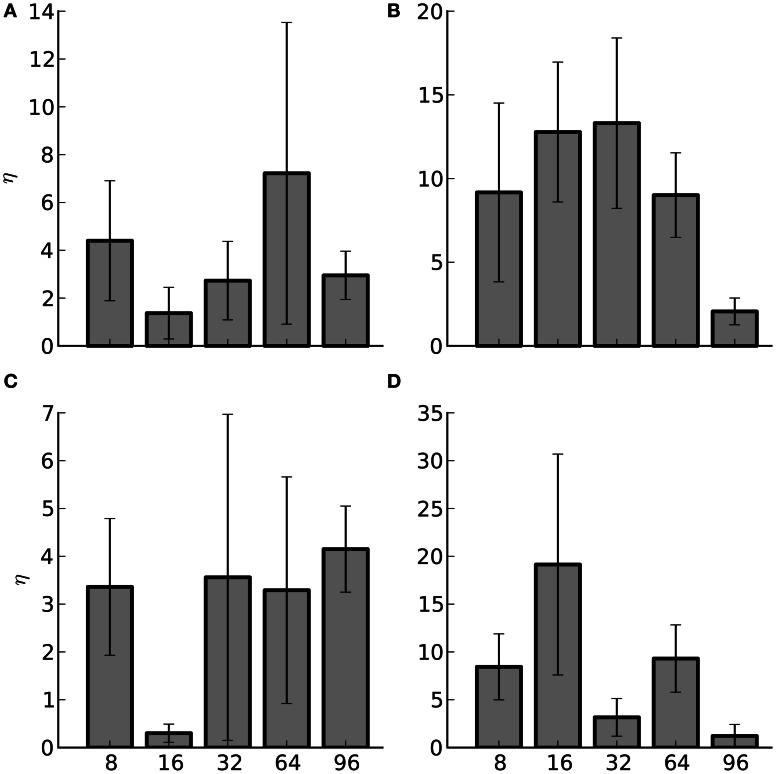
Figure 7.
Average percent improvement between the hybrid method and the AER method (η) and the standard error of the mean (SEM) for Infiniband hardware. The number of nodes are listed along the x-axis. The subplots are: (A) Strong scaling for 1000 efferent synapses. (B) Strong scaling for 10,000 efferent synapses. (C) Weak scaling for 1000 efferent synapses. (D) Weak scaling for 10,000 efferent synapses.

