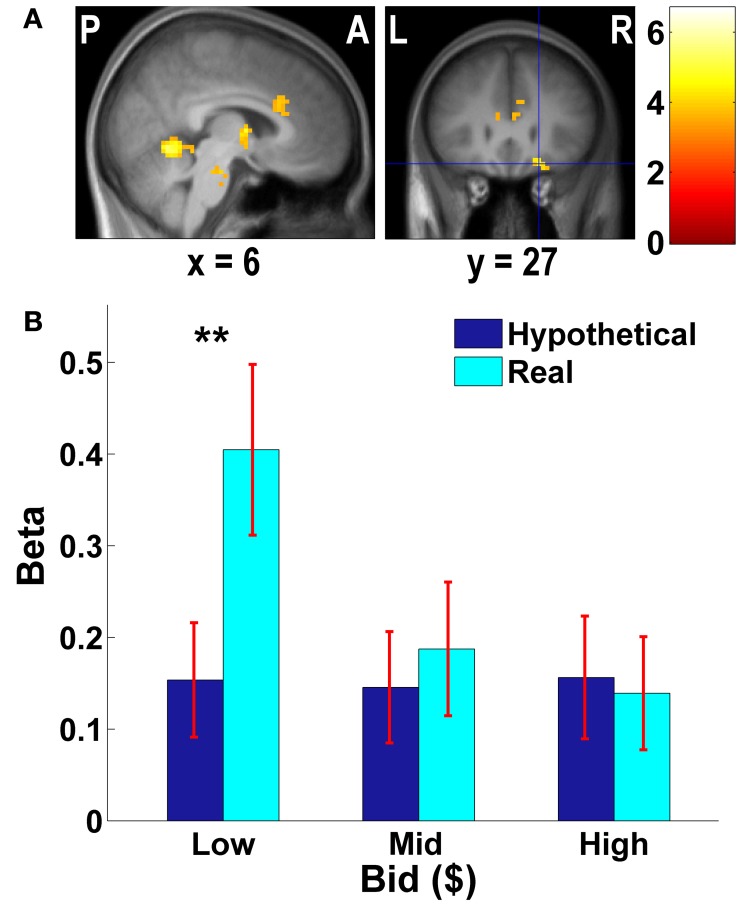
Figure 3.
Frontal areas exhibiting higher negative correlation with real bids than hypothetical bids. (A) Deactivations in the [real × bid − hypothetical × bid] contrast (p < 0.001, uncorrected; threshold k ≥ 5 voxels). The color bar on the right indicates the t-score. (B) Average response in the OFC area to different levels of bids by trial type. The OFC mask was defined as a vmPFC area (peak at x = 21, y = 27, z = −18) identified in the [real × bid - hypothetical × bid] contrast [the area with crosshairs shown in the right panel of (A)]. β values extracted from this OFC mask. **p = 0.016, no asterisk = not significant, paired two-sample t-test.

